python 进程内存增长问题, 解决方法和工具,python增长,转载:http://
python 进程内存增长问题, 解决方法和工具,python增长,转载:http://
转载:http://drmingdrmer.github.io/tech/programming/2017/05/06/python-mem.html#pyrasite-%E8%BF%9E%E6%8E%A5%E8%BF%9B%E5%85%A5python%E7%A8%8B%E5%BA%8F
表现解决方法定位问题过程gdb-python: 搞清楚python程序在做什么准备gdb接入gdb查看线程查看调用栈coredump其他命令pyrasite: 连接进入python程序psutil 查看python进程状态guppy 取得内存使用的各种对象占用情况无法回收的对象不可回收对象的例子 ??objgraph 查找循环引用表现
运行环境:
# uname -aLinux ** 3.10.0-327.el7.x86_64 #1 SMP Thu Nov 19 22:10:57 UTC 2015 x86_64 x86_64 x86_64 GNU/Linux# python2 --versionPython 2.7.5# cat /etc/*-releaseCentOS Linux release 7.2.1511 (Core)
python程序在长时间(较大负载)运行一段时间后, python 进程的系统占用内存持续升高:
# ps aux | grep python2USER PID %CPU %MEM VSZ RSS TTY STAT START TIME COMMANDroot 124910 10.2 0.8 5232084 290952 ? Sl Mar17 220:37 python2 offline.py restart# ~~~~~~# 290M 内存占用
这里的python进程在经历大量请求处理过程中, 内存持续升高, 但最终负载压力下降之后, 内存个并没有下降.
解决方法
为了节省读者时间, 这里先给出结论, 后面再记录详细的排查步骤.
我们分几个步骤逐步定位到问题所在:
首先确定当时程序在做什么, 是否有异常行为.排除行为异常之后, 查看python的内存使用情况, 是否所有该回收的对象都回收了.排除垃圾回收等python内部的内存泄漏问题后, 定位到时libc的malloc实现的问题.而最后的解决方法也很简单, 直接替换malloc模块为tcmalloc:
LD_PRELOAD="/usr/lib64/libtcmalloc.so" python x.py
定位问题过程
gdb-python: 搞清楚python程序在做什么
首先要确定python在做什么, 是不是有正常的大内存消耗任务在运行, 死锁等异常行为.
这方面可以用gdb来帮忙, 从gdb-7开始, gdb支持用python来实现gdb的扩展. 我们可以像调试c程序那样, 用gdb对python程序检查线程, 调用栈等.
而且可以将python代码和内部的c代码的调用栈同时打印出来.
这样对不确定是python代码问题还是其底层c代码的问题的时候, 很有帮助.
以下步骤的详细信息可以参考debug-with-gdb.
准备gdb
首先安装python的debuginfo:
# debuginfo-install python-2.7.5-39.el7_2.x86_64
如果缺少debuginfo, 运行后面的步骤gdb会提示blabla, 按照提示安装完继续就好:
Missing separate debuginfos, use: debuginfo-install python-2.7.5-39.el7_2.x86_64
接入gdb
然后我们可以直接用gdb attach到1个python进程, 来查看它的运行状态:
# gdb python 11122
attach 之后进入了gdb, 能做的事情就多了. 几个基本的检查步骤:
查看线程
(gdb) info threads Id Target Id Frame 206 Thread 0x7febdbfe3700 (LWP 124916) "python2" 0x00007febe9b75413 in select () at ../sysdeps/unix/syscall-template.S:81 205 Thread 0x7febdb7e2700 (LWP 124917) "python2" 0x00007febe9b75413 in select () at ../sysdeps/unix/syscall-template.S:81 204 Thread 0x7febdafe1700 (LWP 124918) "python2" 0x00007febe9b75413 in select () at ../sysdeps/unix/syscall-template.S:81 203 Thread 0x7febda7e0700 (LWP 124919) "python2" 0x00007febe9b7369d in poll () at ../sysdeps/unix/syscall-template.S:81
一般加锁死锁差不多可以在这里看到, 会有线程卡在xx_wait之类的函数上.
之前用这个方法定位了1个python-logging模块引起的, 在多线程的进程中运行fork, 导致logging的锁被锁住后fork到新的进程, 但解锁线程没有fork到新进程而造成的死锁问题.
查看调用栈
如果发现某个线程有问题, 切换到那个线程上, 查看调用栈确定具体的执行步骤, 使用bt命令:
(gdb) bt#16 0x00007febea8500bd in PyEval_EvalCodeEx (co=<optimized out>, globals=<optimized out>, [email protected]=0x0, args=<optimized out>, argcount[email protected]=1, kws=0x38aa668, kwcount=2, defs=0x3282a88, defcount=2, closure[email protected]=0x0) at /usr/src/debug/Python-2.7.5/Python/ceval.c:3330...#19 PyEval_EvalFrameEx ( f[email protected]=Frame 0x38aa4d0, for file t.py, line 647, in run (part_num=2, consumer=<...
bt命令不仅可以看到c的调用栈, 还会显示出python源码的调用栈, 想上面frame-16是c的, frame-19显示出在python的源代码对应哪1行.
如果只查看python的代码的调用栈, 使用py-bt命令:
(gdb) py-bt#1 <built-in method poll of select.epoll object at remote 0x7febeacc5930>#3 Frame 0x3952450, for file /usr/lib64/python2.7/site-packages/twisted/internet/epollreactor.py, line 379, in doPoll (self=<... l = self._poller.poll(timeout, len(self._selectables))#7 Frame 0x39502a0, for file /usr/lib64/python2.7/site-packages/twisted/internet/base.py, line 1204, in mainLoop (self=<...
py-bt显示出python源码的调用栈, 调用参数, 以及所在行的代码.
coredump
如果要进行比较长时间的跟踪, 最好将python程序的进程信息全部coredump出来, 之后对core文件进行分析, 避免影响正在运行的程序.
(gdb) generate-core-file
这条命令将当前gdb attach的程序dump到它的运行目录, 名字为core.<pid>, 然后再用gdb 加载这个core文件, 进行打印堆栈, 查看变量等分析, 无需attach到正在运行的程序:
# gdb python core.<pid>
其他命令
其他命令可以在gdb输入py<TAB><TAB>看到, 和gdb的命令对应, 例如:
(gdb) pypy-bt py-list py-print pythonpy-down py-locals py-up python-interactive
py-up,py-down可以用来移动到python调用站的上一个或下一个frame.py-locals用来打印局部变量等等等等. gdb里也可以用help命令查看帮助:
(gdb) help py-printLook up the given python variable name, and print it
在这次追踪过程中, 用gdb-python排除了程序逻辑问题. 然后继续追踪内存泄漏问题:
pyrasite: 连接进入python程序
pyrasite 是1个可以直接连上一个正在运行的python程序, 打开一个类似ipython的交互终端来运行命令来检查程序状态.
这给我们的调试提供了非常大的方便. 简直神器.
安装:
# pip install pyrasite...# pip show pyrasiteName: pyrasiteVersion: 2.0Summary: Inject code into a running Python processHome-page: http://pyrasite.comAuthor: Luke Macken...
连接到有问题的程序上, 开始收集信息:
pyrasite-shell <pid>>>>
接下来就可以在<pid>的进程里调用任意的python代码, 来查看进程的状态.
下面是几个小公举(特么的输入法我是说工具..)可以用来在进程内查看内存状态的:
psutil 查看python进程状态
pip install psutil
首先看下python进程占用的系统内存RSS:
pyrasite-shell 11122>>> import psutil, os>>> psutil.Process(os.getpid()).memory_info().rss29095232
基本和ps命令显示的结果一致
rss the real memory (resident set) size of the process (in 1024 byte units).
guppy 取得内存使用的各种对象占用情况
guppy 可以用来打印出各种对象各占用多少空间, 如果python进程中有没有释放的对象, 造成内存占用升高, 通过guppy可以查看出来:
同样, 以下步骤是在通过pyrasite-shell, attach到目标进程后操作的.
# pip install guppyfrom guppy import hpyh = hpy()h.heap()# Partition of a set of 48477 objects. Total size = 3265516 bytes.# Index Count % Size % Cumulative % Kind (class / dict of class)# 0 25773 53 1612820 49 1612820 49 str# 1 11699 24 483960 15 2096780 64 tuple# 2 174 0 241584 7 2338364 72 dict of module# 3 3478 7 222592 7 2560956 78 types.CodeType# 4 3296 7 184576 6 2745532 84 function# 5 401 1 175112 5 2920644 89 dict of class# 6 108 0 81888 3 3002532 92 dict (no owner)# 7 114 0 79632 2 3082164 94 dict of type# 8 117 0 51336 2 3133500 96 type# 9 667 1 24012 1 3157512 97 __builtin__.wrapper_descriptor# <76 more rows. Type e.g. ‘_.more‘ to view.>h.iso(1,[],{})# Partition of a set of 3 objects. Total size = 176 bytes.# Index Count % Size % Cumulative % Kind (class / dict of class)# 0 1 33 136 77 136 77 dict (no owner)# 1 1 33 28 16 164 93 list# 2 1 33 12 7 176 100 int通过以上步骤, 可以看出并没有很多python对象占用更大内存.
无法回收的对象
python本身是有垃圾回收的, 但python程序中有种情况是对象无法被垃圾回收掉(uncollectable object), 满足2个条件:
循环引用循环引用的链上某个对象定义了__del__方法.官方的说法是, 循环引用的一组对象被gc模块识别为可回收的, 但需要先调用每个对象上的__del__方法, 才能回收. 但用户自定义了__del__的对象, gc系统不知道应该先调用环上的哪个__del__. 因此无法回收这类对象.
不能回收的python对象会持续占据内存, 当问题查到这里时我们怀疑有不能被回收的对象导致内存持续升高.
于是我们尝试列出所有不能回收的对象.
后来确定不是这种问题引起的内存不释放. 不能回收任然可以通过gc.get_objects()列出来, 并会在gc.collect()调用后被加入到gc.garbage的list里. 但我们没有发现这类对象的存在.
查找uncollectable的对象:
pyrasite-shell 11122>>> import gc>>> gc.collect() # first run gc, find out uncollectable object and put them in gc.garbage # output number of object collected>>> gc.garbage # print all uncollectable objects[] # empty
如果在上面最后一步打印出了任何不能回收的对象, 则需要进一步查找循环引用链上在哪个对象上包含__del__方法.
下面是1个例子来演示如何生成不能回收的对象:
不可回收对象的例子 ??
uncollectible.py
from __future__ import print_functionimport gc‘‘‘This snippet shows how to create a uncollectible object:It is an object in a cycle reference chain, in which there is an objectwith __del__ defined.The simpliest is an object that refers to itself and with a __del__ defined. > python uncollectible.py ======= collectible object ======= *** init, nr of referrers: 4 garbage: [] created: collectible: <__main__.One object at 0x102c01090> nr of referrers: 5 delete: *** __del__ called *** after gc, nr of referrers: 4 garbage: [] ======= uncollectible object ======= *** init, nr of referrers: 4 garbage: [] created: uncollectible: <__main__.One object at 0x102c01110> nr of referrers: 5 delete: *** after gc, nr of referrers: 5 garbage: [<__main__.One object at 0x102c01110>]‘‘‘def dd(*msg): for m in msg: print(m, end=‘‘) print()class One(object): def __init__(self, collectible): if collectible: self.typ = ‘collectible‘ else: self.typ = ‘uncollectible‘ # Make a reference to it self, to form a reference cycle. # A reference cycle with __del__, makes it uncollectible. self.me = self def __del__(self): dd(‘*** __del__ called‘)def test_it(collectible): dd() dd(‘======= ‘, (‘collectible‘ if collectible else ‘uncollectible‘), ‘ object =======‘) dd() gc.collect() dd(‘*** init, nr of referrers: ‘, len(gc.get_referrers(One))) dd(‘ garbage: ‘, gc.garbage) one = One(collectible) dd(‘ created: ‘, one.typ, ‘: ‘, one) dd(‘ nr of referrers: ‘, len(gc.get_referrers(One))) dd(‘ delete:‘) del one gc.collect() dd(‘*** after gc, nr of referrers: ‘, len(gc.get_referrers(One))) dd(‘ garbage: ‘, gc.garbage)if __name__ == "__main__": test_it(collectible=True) test_it(collectible=False)
上面这段代码创建了2个对象, 1个可以回收, 1个不能回收, 他们2个都定义了__del__方法, 唯一区别就是是否引用了自己(从而构成了引用环).
如果在这个步骤发现了循环引用, 就要进一步查处哪些引用关系造成了循环引用, 进而破坏掉循环引用, 让对象变成可以回收的.
objgraph 查找循环引用
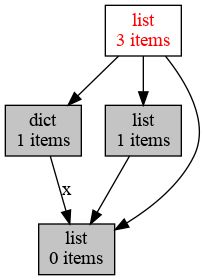
# pip install objgraphpyrasite-shell 11122>>> import objgraph>>> objgraph.show_refs([an_object], filename=‘sample-graph.png‘)
上面的例子中, 将在本地生成一个图片, 描述由可以由 an_object 引用到的关系图:
具体参考:objgraph
在这一步我们也没有找到不能回收的对象, 最后我们怀疑到时glibc的malloc的问题, 用tcmalloc替代glibc默认的malloc后问题得到修复.
Archive
20 Nov 2017python 并发subprocess.Popen的坑05 Aug 2017程序员必读: 摸清hash表的脾性06 May 2017python 进程内存增长问题, 解决方法和工具01 Feb 2017xp的分布式系统系列教程之: Erasure-Code: 工作原理, 数学解释, 实践和分析.01 Feb 2017xp的分布式系统系列教程之: Erasure-Code: 工作原理, 数学解释, 实践和分析.11 Nov 2015可靠分布式系统基础 Paxos 的直观解释28 Jul 2015socket关闭: close()和shutdown()的差异17 May 2015随手改变世界之 git-auto-squash17 Feb 2015Numbers Programmers Should Know About Hash11 Feb 2015Vim-tabbar: Simple, stupid and fast tab-bar for VIM24 Jul 20141% 慢请求优化31 Jan 2014Some useful resources31 Jan 2014jobq.py -- Queue processing enginepython 进程内存增长问题, 解决方法和工具
相关内容
- Python学习笔记(四十五)网络编程(1)TCP编程,pytho
- Python-功能函数的使用(三),python-函数,使用可选的可
- Python第三方模块tesserocr安装,pythontesserocr,介绍在爬虫过
- 玩了下opencv的aruco(python版),opencvaruco,简单的玩了下
- python正则表达式re 中m.group和m.groups的解释,m.groupm.gro
- python2 与python3中最大的区别(编码问题bytes&str,
- ubuntu16.04下python2、python3环境选择与python升级,python2p
- 史上最全python面试题详解 (二)(附带详细答案(关注
- python-Zip方法,,zip返回一个将多个
- python 闯关之路一(语法基础),python闯关,1,什么是编
评论关闭