python 使用 matplotlib.pyplot来画柱状图和饼图,,导入包import
python 使用 matplotlib.pyplot来画柱状图和饼图,,导入包import
导入包
import matplotlib.pyplot as plt
柱状图
最简柱状图
# 显示高度def autolabel(rects): for rect in rects: height = rect.get_height() plt.text(rect.get_x()+rect.get_width()/2.- 0.2, 1.03*height, ‘%s‘ % int(height))name_list = [‘A‘, ‘B‘, ‘C‘, ‘D‘, ‘E‘, ‘F‘, ‘G‘, ‘H‘]num_list = [33, 44, 53, 16, 11, 17, 17, 10]autolabel(plt.bar(range(len(num_list)), num_list, color=‘rgb‘, tick_label=name_list))plt.show()
结果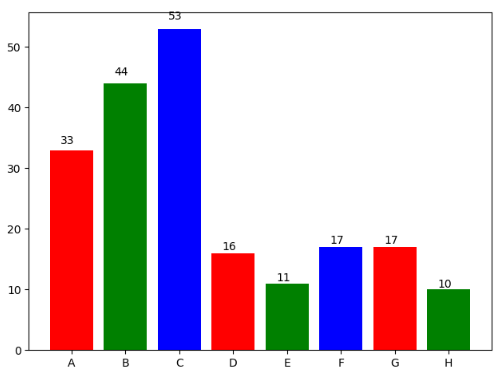
堆叠柱状图
# 显示高度def autolabel(rects1, rects2): i = 0 for rect1 in rects1: rect2 = rects2[i] i += 1 height = rect1.get_height() + rect2.get_height() plt.text(rect1.get_x()+rect1.get_width()/2. - 0.1, 1.03*height, ‘%s‘ % int(height))name_list = [‘A‘, ‘B‘, ‘C‘, ‘D‘]num_list = [10, 15, 16, 28]num_list2 = [10, 12, 18, 26]z1 = plt.bar(range(len(num_list)), num_list, label=‘1‘, fc=‘b‘)z2 = plt.bar(range(len(num_list)), num_list2, bottom=num_list, label=‘2‘, tick_label=name_list, fc=‘g‘)autolabel(z1, z2)plt.legend()plt.show()
结果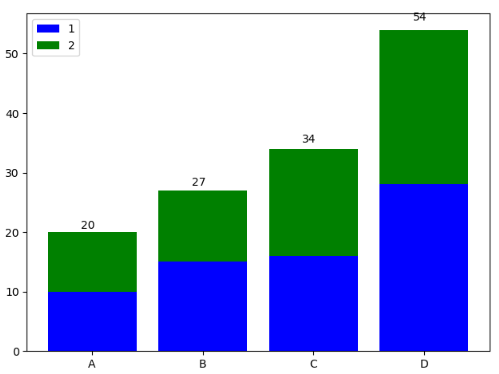
并列柱状图
name_list = [‘A‘, ‘B‘, ‘C‘, ‘D‘]num_list = [10, 15, 16, 28]num_list2 = [10, 12, 18, 26]x = list(range(len(num_list)))total_width, n = 0.8, 2width = total_width / nplt.bar(x, num_list, width=width, label=‘1‘, fc=‘b‘)for i in range(len(x)): x[i] += widthplt.bar(x, num_list2, width=width, label=‘2‘, tick_label=name_list, fc=‘g‘)plt.legend()plt.show()
结果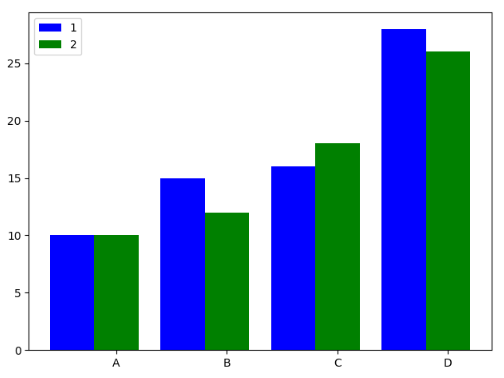
饼图
最简饼图
name_list = [‘A‘, ‘B‘, ‘C‘, ‘D‘, ‘E‘, ‘F‘, ‘G‘, ‘H‘, ‘I‘, ‘J‘]num_list = [33, 44, 53, 6,11, 7, 7, 10, 3, 1]# 保证圆形plt.axes(aspect=1)plt.pie(x=num_list, labels=name_list, autopct=‘%3.1f %%‘)plt.show()
结果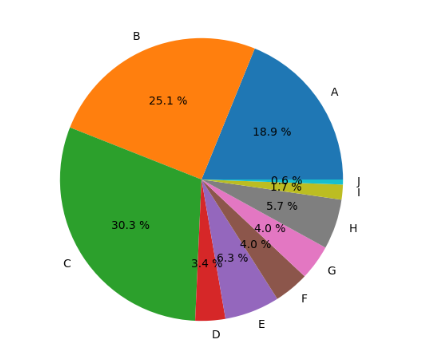
带切割的饼图
# 圆形plt.figure(1, figsize=(6, 6))name_list = [‘A‘, ‘B‘, ‘C‘, ‘D‘, ‘E‘]num_list = [33, 44, 53, 30, 60]expl = [0, 0, 0, 0, 1]colors = [‘pink‘, ‘blue‘, ‘yellow‘, ‘green‘, ‘red‘]plt.pie(x=num_list,explode=expl, labels=name_list, autopct=‘%3.1f %%‘, colors=colors, pctdistance=0.3, shadow=True)plt.show()
结果
python 使用 matplotlib.pyplot来画柱状图和饼图
相关内容
- 如何美观地打印 Python 对象?这个标准库可以简单实现
- python3 获取阿里云OSS 最新存储容量 SDK API,,模块aliyun
- 学习随笔 --python实现熵权法,,一、熵权法介绍熵最先
- python将整数均分成N等分,,在python中,需
- HTMLTestRunner_PY3.py支持 python3.x github python3版本,,github源
- python第三方库 - dateurtil,,简介 扩展并增强
- Appium+Python之PO模型(Page object Model),,思考:我们进行
- Python学习---IO的异步[gevent+Grequests模块],,安装gevent模块
- 用Python可视化股票指标,,用Python可视化
- (3) python--matplotlib,,(一)1.如何绘制散
评论关闭