Python:Django框架开发数据可视化网站,数据可视化框架,Step 0: 使用
Python:Django框架开发数据可视化网站,数据可视化框架,Step 0: 使用
Step 0: 使用新的 virtualenv 环境
建议使用 1.11.4 版本的 Django
$ virtualenv --no-site-packages pyecharts-env$ source pyecharts-env/bin/activate$ pip install django==1.11.4$ pip install pyecharts
Step 1: 新建一个 django 项目
$ django-admin startproject myechartsite
创建一个应用程序
$ python manage.py startapp myfirstvis$ lsdb.sqlite3 manage.py myechartsite myfirstvis
在myechartsite/settings.py中注册应用程序
# myechartsite/settings.pyINSTALLED_APPS = [ ‘django.contrib.admin‘, ‘django.contrib.auth‘, ‘django.contrib.contenttypes‘, ‘django.contrib.sessions‘, ‘django.contrib.messages‘, ‘django.contrib.staticfiles‘, ‘myfirstvis‘ # <---]
我们先编辑 urls.py.这文件在 Django 里的功能是把前段的 HTTP 需求和后台服务函数挂钩。在 Step3,我们再引入后端服务函数
1 # myfirstvis/urls.py2 from django.conf.urls import url3 4 from . import views5 6 urlpatterns = [7 url(r‘^$‘, views.index, name=‘index‘),8 ]
在myechartsite/urls.py中新增 ‘myfirstvis.urls‘
1 myechartsite/urls.py2 from django.conf.urls import include, url3 from django.contrib import admin4 5 urlpatterns = [6 url(r‘^admin/‘, admin.site.urls),7 url(r‘myfirstvis/‘, include(‘myfirstvis.urls‘)) # <---8 ]
Step 2: 处理视图功能部分
将下列代码保存到myfirstvis/views.py中。
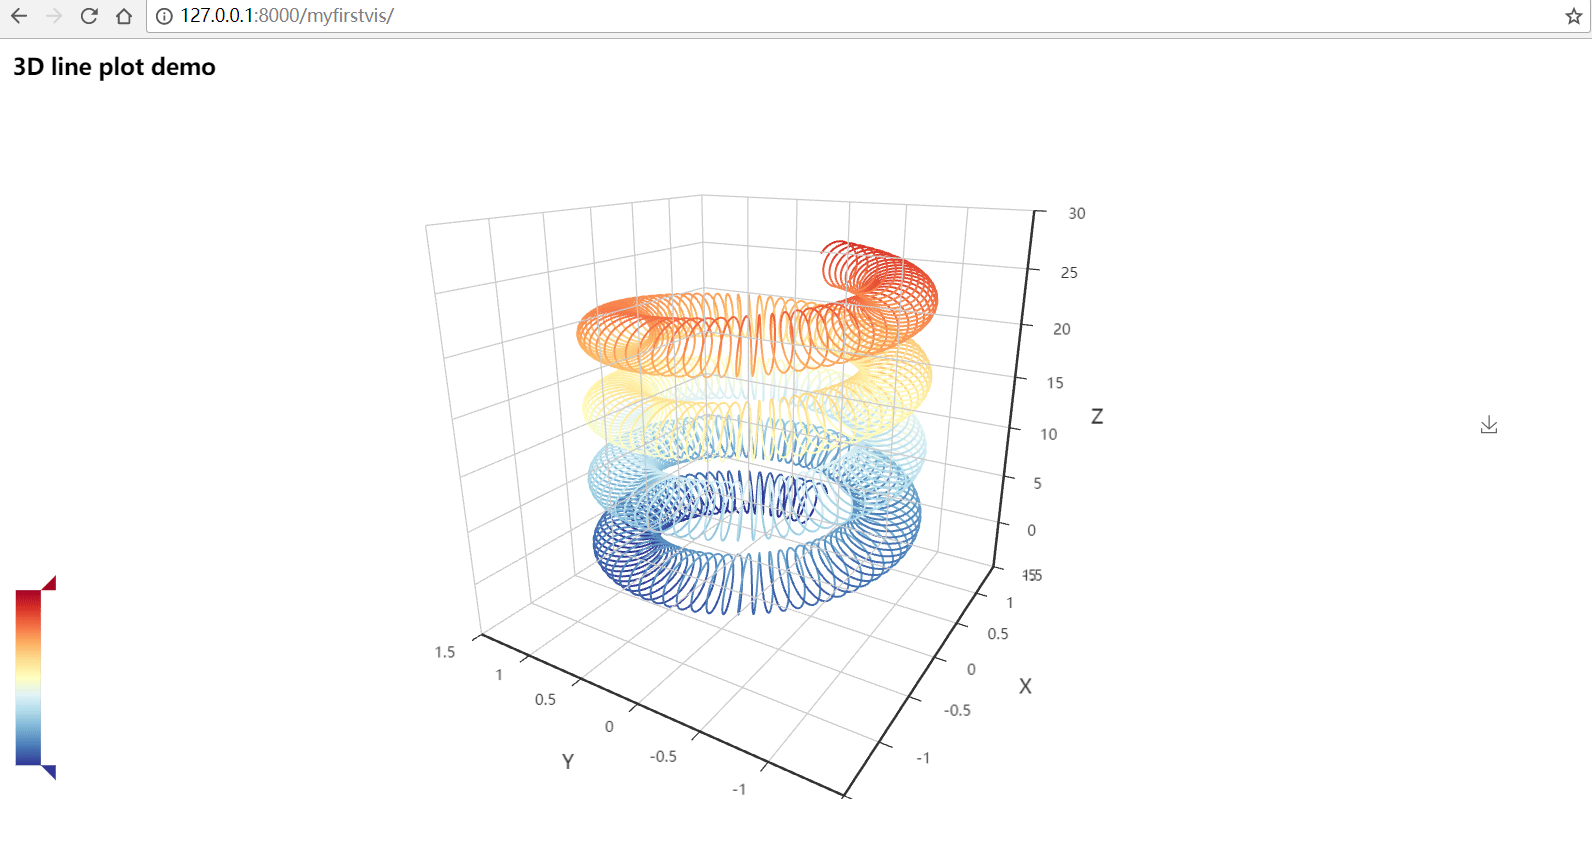
1 from __future__ import unicode_literals 2 import math 3 4 from django.http import HttpResponse 5 from django.template import loader 6 from pyecharts import Line3D 7 8 9 REMOTE_HOST = "https://pyecharts.github.io/assets/js"10 11 12 def index(request):13 template = loader.get_template(‘myfirstvis/pyecharts.html‘)14 l3d = line3d()15 context = dict(16 myechart=l3d.render_embed(),17 host=REMOTE_HOST,18 script_list=l3d.get_js_dependencies()19 )20 return HttpResponse(template.render(context, request))21 22 23 def line3d():24 _data = []25 for t in range(0, 25000):26 _t = t / 100027 x = (1 + 0.25 * math.cos(75 * _t)) * math.cos(_t)28 y = (1 + 0.25 * math.cos(75 * _t)) * math.sin(_t)29 z = _t + 2.0 * math.sin(75 * _t)30 _data.append([x, y, z])31 range_color = [32 ‘#313695‘, ‘#4575b4‘, ‘#74add1‘, ‘#abd9e9‘, ‘#e0f3f8‘, ‘#ffffbf‘,33 ‘#fee090‘, ‘#fdae61‘, ‘#f46d43‘, ‘#d73027‘, ‘#a50026‘]34 line3d = Line3D("3D line plot demo", width=1200, height=600)35 line3d.add("", _data, is_visualmap=True,36 visual_range_color=range_color, visual_range=[0, 30],37 is_grid3D_rotate=True, grid3D_rotate_speed=180)38 return line3dcript_list是 Page() 类渲染网页所需要依赖的 echarts js 库,依赖的库的数量取决于所要渲染的图形种类。
host是 echarts js 库的地址,默认提供的地址为https://pyecharts.github.io/assets/js当然,如果你愿意你也可以改变这个地址,先克隆https://github.com/pyecharts/assets然后将js文件夹挂载在你自己的服务器上即可。
Step 3: 为项目提供自己的模板
Windows 系统
在 myfirstvis 目录下,新建 templates/myfirstvis 子目录
myfirstvis 目录
─ myfirstvis ├── admin.py ├── apps.py ├── __init__.py ├── migrations │ ├── __init__.py ├── models.py ├── templates │ └── myfirstvis │ └── pyecharts.html ├── tests.py ├── urls.py └── views.py
将下面 html 模板代码保存为 pyecharts.html,请确保 pyecharts.html 文件的绝对路径为<project root>/myfirstvis/templates/myfirstvis
1 <!-- myfirstvis/templates/pyecharts.html --> 2 <!DOCTYPE html> 3 <html> 4 5 <head> 6 <meta charset="utf-8"> 7 <title>Proudly presented by PycCharts</title> 8 {% for jsfile_name in script_list %} 9 <script src="{{ host }}/{{ jsfile_name }}.js"></script>10 {% endfor %}11 </head>12 13 <body>14 {{ myechart|safe }}15 </body>16 17 </html>Step 4: 运行项目
$ cd myechartsite$ python manage.py runserverYou have 13 unapplied migration(s). Your project may not work properly until you apply the migrations for app(s): admin, auth, contenttypes, sessions.Run ‘python manage.py migrate‘ to apply them.August 08, 2017 - 05:48:38Django version 1.11.4, using settings ‘myechartsite.settings‘Starting development server at http://127.0.0.1:8000/Quit the server with CONTROL-C.
访问http://localhost:8000/myfirstvis/,你就可以看到酷炫的 3D 图了

小结
看到了吧,只需要简单的几步就可以使用 pyecharts 创建可视化的图表。Django 官方教程需要七步的这里我们三步就搞定了。
Python:Django框架开发数据可视化网站
相关内容
- Python之路【第二十七篇】:web服务器django,中国七十年之
- Python中的各种转义符,以下字符中不是转义符的,转义字
- python2项目出现的错误(UnicodeDecodeError),python错误,刚启动
- python2.6.6升级python2.7.14,python2.7,Centos 6.8
- python--面向对象,python3面向对象,面向对象与面向过程的
- python案例——体脂率项目,python项目案例,通过一个人的
- Python之路【第二十三篇】:数据库基础,三流之路有第二
- Python进阶之浅谈内置方法,改善进阶方法有哪些, 目
- python程序常见错误及执行方式,python重新执行程序,认识
- Python基础:编码规范(4),编码基础,1.命名规范
评论关闭