啥?Python竟然也可以制作萌萌的手绘图表,
啥?Python竟然也可以制作萌萌的手绘图表,
大家可能已经习惯了用Matplotlib和seaborn来制作不同的图表,但是今天要介绍一个非常酷的Python手绘风格的可视化包:cutecharts。

这个包可以用来生成以下几种看起来像手绘的图表,在某些场景下效果可能更好。这些可爱的图表还具有交互性和动态性。每当鼠标在图表上悬停时,数字就会显示出来。而要创建这种图表,你只需要几行Python代码。
目前,该库支持五种图表--条形图、线形图、饼图、雷达图和散点图。它还支持图表的组合。
在开始绘制可爱的图表之前,我们需要安装 cutechart 库。
- $ pip install cutecharts
安装好后我们来尝试画下条形图和线图。首先创建下数据,以某个城市的温度数据为例。
- #import library and data
- import cutecharts.charts as ctcdf=pd.DataFrame({ ‘x’:[‘Sun.’,’Mon.’,’Tue.’,’Wed.’,’Thu.’,’Fri.’,’Sat.’], ‘y’:[14,15,17,20,22.3,23.7,24.8], ‘z’:[16,16.4,23.6,24.5,19.9,13.6,13.4]})
1、条形图
代码:
- chart = ctc.Bar(‘Toronto Temperature’,width=’500px’,height=’400px’)
- chart.set_options( labels=list(df[‘x’]), x_label='Days', y_label='Temperature (Celsius)' , colors=[‘#1EAFAE’ for i in range(len(df))] )
- chart.add_series('This week',list(df[‘y’]))
- chart.render_notebook()
效果:
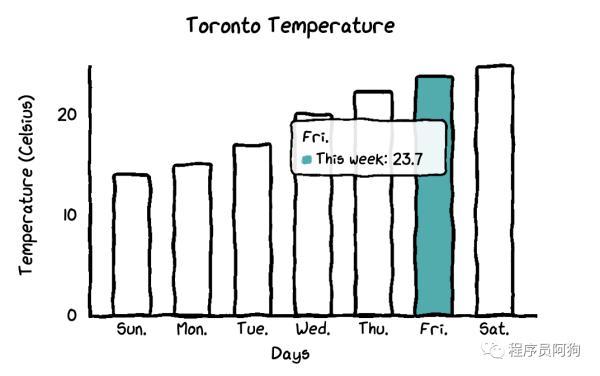
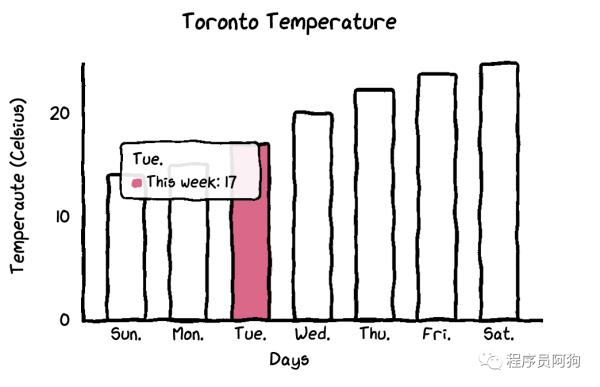
在这个条形图中,所有的条形图都有相同的颜色。如果你想自定义每个条形图的颜色,你只需要更改一行代码。
- chart = ctc.Bar(‘title’,width=’500px’,height=’400px’)
- chart.set_options( labels=list(df[‘x’]), x_label=”Days”, y_label=”Temperature (Celsius)” , colors=[‘#FFF1C9’,’#F7B7A3',’#EA5F89',’#9B3192',’#57167E’,’#47B39C’,’#00529B’] )
- chart.add_series(“This week”,list(df[‘y’]))
- chart.render_notebook()
2、线图
如果想观察时间序列数据的变动差异,线图无疑更直观。
代码:
- chart = ctc.Line(“Toronto Temperature”,width=’500px’,height=’400px’)
- chart.set_options( labels=list(df[‘x’]), x_label=”Days”, y_label=”Temperature (Celsius)” )
- chart.add_series(“This Week”, list(df[‘y’]))
- chart.add_series(“Last Week”, list(df[‘z’]))
- chart.render_notebook()
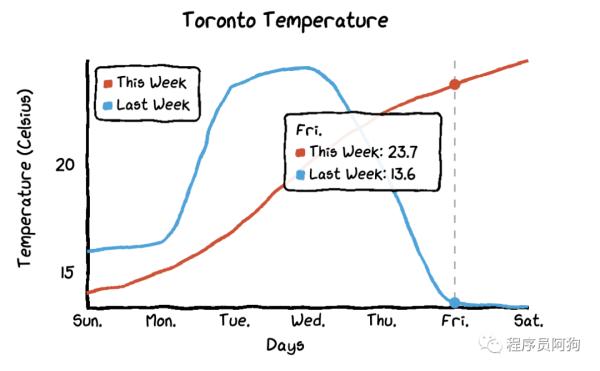
还有一个特别的功能:
当你把鼠标悬停在图表上时,图表会自动显示带有数字的标签,而且还画了一条虚线,这样本周和上周的气温差异就更加直观了。
3、雷达图
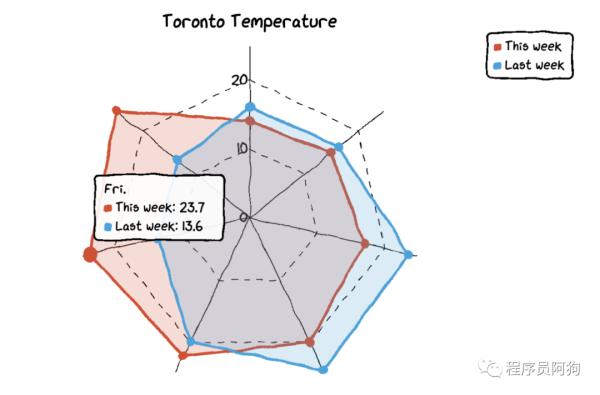
要将线型图改为雷达图,你只需要将图表类型改为ctc.Radar。
代码:
- chart = ctc.Radar(‘Toronto Temperature’,width=’700px’,height=’600px’)
- chart.set_options( labels=list(df[‘x’]), is_show_legend=True, #by default, it is true. You can turn it off. legend_pos=’upRight’ #location of the legend )
- chart.add_series(‘This week’,list(df[‘y’]))
- chart.add_series(“Last week”,list(df[‘z’]))
- chart.render_notebook()
效果:
4、饼图
我们需要另一个数据集来制作饼图和甜甜圈图。
创建数据集:
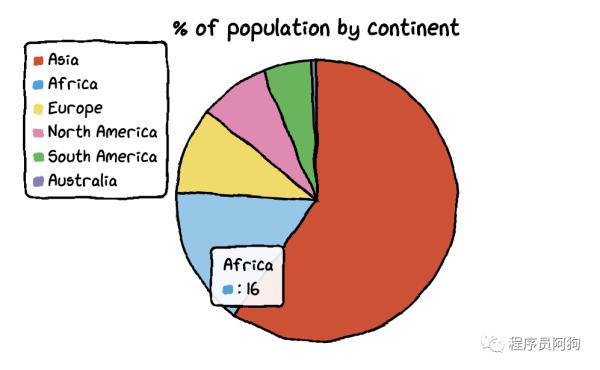
- df=pd.DataFrame({‘x’:[‘Asia’, ‘Africa’, ‘Europe’, ‘North America’, ‘South America’, ‘Australia’], ‘y’:[59.69, 16, 9.94, 7.79, 5.68, 0.54]})
这个数据集包含了大洲名称和人口占比。
- chart = ctc.Pie(‘% of population by continent’,width=’500px’,height=’400px’)
- chart.set_options( labels=list(df[‘x’]), inner_radius=0 )
- chart.add_series(list(df[‘y’]))
- chart.render_notebook()
效果:
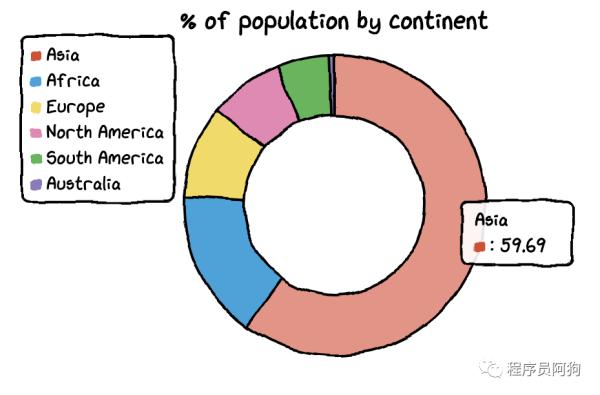
而且把饼图变成甜甜圈图也很容易。你只需要改变inner_radius的参数。
代码:
- df=pd.DataFrame({‘x’:[‘Asia’, ‘Africa’, ‘Europe’, ‘North America’, ‘South America’, ‘Australia’], ‘y’:[59.69, 16, 9.94, 7.79, 5.68, 0.54]})
- chart = ctc.Pie(‘% of population by continent’,width=’500px’,height=’400px’)
- chart.set_options( labels=list(df[‘x’]), inner_radius=0.6 )
- chart.add_series(list(df[‘y’]))
- chart.render_notebook()
5、散点图
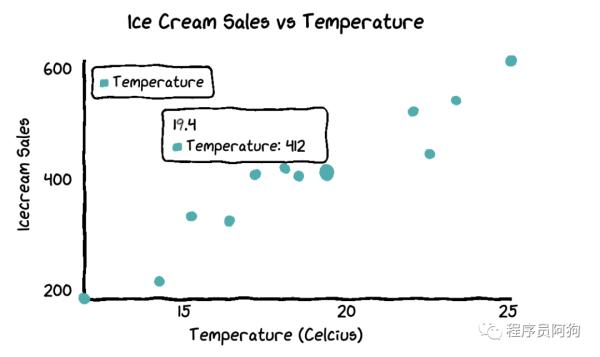
为了绘制散点图,我将创建一个新的数据集。这次我们用到的是温度和冰淇淋销量数据。
数据集:
- Temperature = [14.2,16.4,11.9,15.2,18.5,22.1,19.4,25.1,23.4,18.1,22.6,17.2]
- Sales = [215,325,185,332,406,522,412,614,544,421,445,408]
散点图代码:
- chart = ctc.Scatter(‘Ice Cream Sales vs Temperature’,width=’500px’,height=’600px’)
- chart.set_options( x_label=”Temperature (Celcius)”, y_label=”Icecream Sales” , colors=[‘#1EAFAE’], is_show_line = False, dot_size=1)
- chart.add_series(“Temperature”, [(z[0], z[1]) for z in zip(Temperature, Sales)])
- chart.render_notebook()
6、组合图
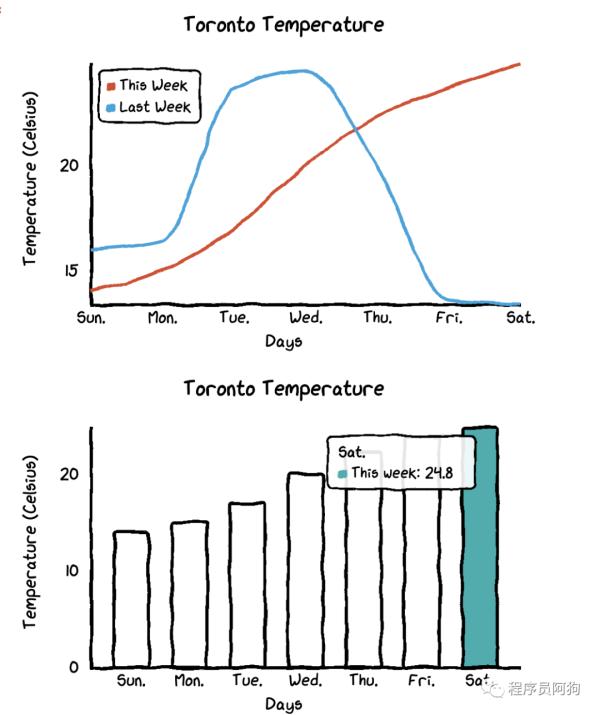
如果你想把多个图表组合在一起,那么代码也不复杂。
- chart1 = ctc.Line(“Toronto Temperature”,width=’500px’,height=’400px’)
- chart1.set_options( labels=list(df[‘x’]), x_label=”Days”, y_label=”Temperature (Celsius)” )
- chart1.add_series(“This Week”, list(df[‘y’]))
- chart1.add_series(“Last Week”, list(df[‘z’]))
- chart2 = ctc.Bar(‘Toronto Temperature’,width=’500px’,height=’400px’)
- chart2.set_options( labels=list(df[‘x’]), x_label=”Days”, y_label=”Temperature (Celsius)” , colors=[‘#1EAFAE’ for i in range(len(df))] )
- chart2.add_series(“This week”,list(df[‘y’]))
- chart2.add_series(“Last week”,list(df[‘z’]))
- page = Page()page.add(chart1, chart2)
- page.render_notebook()
cutecharts这个包非常简单易用,如果你也喜欢这个风格的图表,就赶快试一下。
评论关闭