python 离群点检测,, 1 import
python 离群点检测,, 1 import
1 import numpy as np 2 import pandas as pd 3 from sklearn.cluster import KMeans 4 import matplotlib.pyplot as mp 5 6 7 def get_data_zs(inputfile): 8 data = pd.read_excel(inputfile, index_col=‘Id‘, encoding=‘gb18030‘) 9 data_zs = 1.0 * (data - data.mean()) / data.std()10 return data, data_zs11 12 13 def model_data_zs(data, k, b):14 model = KMeans(n_clusters=k, n_jobs=4, max_iter=b)15 model.fit(data_zs)16 17 # 标准化数据及其类别18 r = pd.concat(19 [data_zs, pd.Series(model.labels_, index=data.index)], axis=1)20 # print(r.head())21 # 每个样本对应的类别22 r.columns = list(data.columns) + [u‘聚类类别‘] # 重命名表头23 return model, r, k24 25 26 def make_norm(model, k):27 norm = []28 for i in range(k):29 norm_tmp = r[[‘R‘, ‘F‘, ‘M‘]][30 r[u‘聚类类别‘] == i] - model.cluster_centers_[i]31 norm_tmp = norm_tmp.apply(np.linalg.norm, axis=1) # 求出绝对距离32 norm.append(norm_tmp / norm_tmp.median()) # 求相对距离并添加33 norm = pd.concat(norm)34 return norm35 36 37 def draw_discrete_point(threshold):38 mp.rcParams[‘font.sans-serif‘] = [‘SimHei‘]39 mp.rcParams[‘axes.unicode_minus‘] = False40 norm[norm <= threshold].plot(style=‘go‘) # 正常点41 42 discrete_points = norm[norm > threshold] # 离散点阈值43 discrete_points.plot(style=‘rs‘)44 # print(discrete_points)45 46 for i in range(len(discrete_points)): # 离群点做标记47 id = discrete_points.index[i]48 n = discrete_points.iloc[i]49 mp.annotate(‘(%s,%0.2f)‘ % (id, n), xy=(id, n), xytext=(id, n))50 mp.xlabel(r‘编号‘)51 mp.ylabel(r‘相对距离‘)52 mp.show()53 54 if __name__ == ‘__main__‘:55 inputfile = ‘data/consumption_data.xls‘56 threshold = 2 # 离散点阈值57 k = 3 # 聚类类别58 b = 500 # 聚类最大循环次数59 data, data_zs = get_data_zs(inputfile)60 model, r, k = model_data_zs(data, k, b)61 norm = make_norm(model, k)62 draw_discrete_point(threshold)63 print(‘All Done‘)
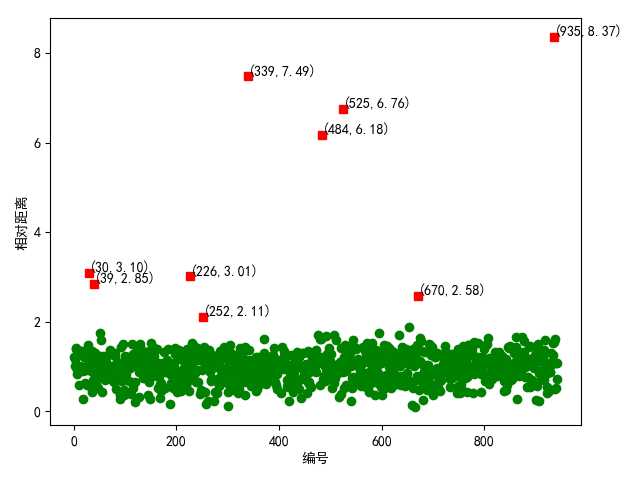
显示结果:
python 离群点检测
评论关闭