用python对股票期货做时序分析,,CFFEX.IF18
用python对股票期货做时序分析,,CFFEX.IF18
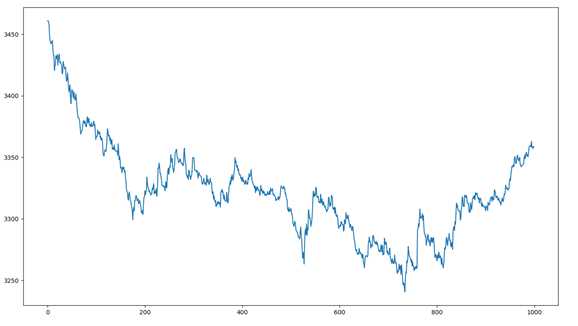
CFFEX.IF1808,截止到当日的1000条收盘价格走势:
# encoding: utf-8import talibfrom talib.abstract import SMAimport numpy as npimport pandas as pdimport mathimport datetimefrom collections import dequefrom gm.api import * #掘金import matplotlib.pyplot as pltimport matplotlib as mplimport mpl_finance as mpfimport matplotlib.dates as mpdimport seaborn as snsimport statsmodels.tsa.stattools as tsimport statsmodels.api as smfrom statsmodels.tsa.arima_model import ARMAfrom scipy import statsfrom statsmodels.graphics.api import qqplotset_token(‘****************************‘) #自行填写自己的token
now=datetime.datetime.now().date()last_day=get_previous_trading_date(exchange=‘SHSE‘,date=now)index_futures=get_continuous_contracts(csymbol=‘CFFEX.IF‘,start_date=last_day,end_date=last_day)#print index_futuresstrike_info=history_n(symbol=‘CFFEX.IF1808‘,frequency=‘60s‘,end_time=‘2018-07-01‘,fields=‘symbol,close,frequency,cum_volume‘,count=1000,df=True)strike_info.dropna()price=np.array(strike_info[‘close‘])
一个时间序列,他可能是有趋势的,是不平稳的,所以如果不平稳需要做差分。
ADF检测结果:
95%置信区间,p=0.0076,99%置信区间下,p=-3.5。对模型做一阶差分,希望得到一个平稳的时间序列
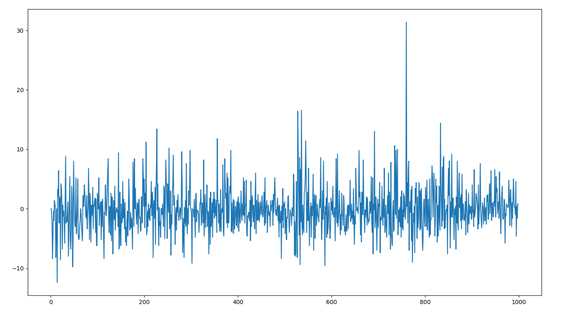
一阶差分后,模型基本平稳:
p=ts.adfuller(strike_info[‘close‘])[0]#print pprice_log=strike_info[‘close‘].diff()
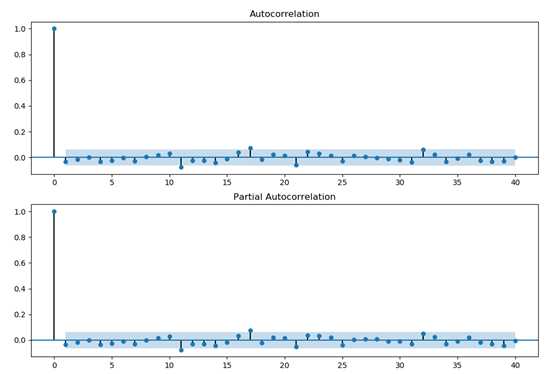
AR(p)模型,PACF会在lag=p时截尾,也就是,PACF图中的值落入宽带区域中。
MA(q)模型,ACF会在lag=q时截尾,同理,ACF图中的值落入宽带区域中。
用ACF(自相关系数)或者PACF(偏自相关系数)观察模型:
fig = plt.figure(figsize=(12,8))ax1=fig.add_subplot(211)fig = sm.graphics.tsa.plot_acf(strike_info[‘close‘],lags=40,ax=ax1)ax2 = fig.add_subplot(212)fig = sm.graphics.tsa.plot_pacf(strike_info[‘close‘],lags=40,ax=ax2)plt.show()
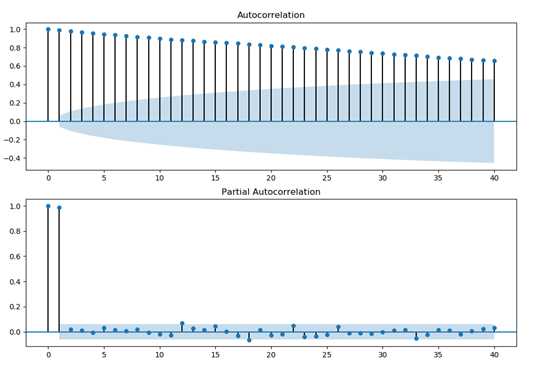
优先选择PACF图,因为PACF大约在lag=1时截尾,即PACF的值落入宽带区域中
选择AR(P=1)的模型进行自回归拟合,得到拟合效果:
arma_mod80 = sm.tsa.ARMA(strike_info[‘close‘],(1,0)).fit()print(arma_mod80.aic,arma_mod80.bic,arma_mod80.hqic)resid = arma_mod80.residprint(sm.stats.durbin_watson(arma_mod80.resid.values))print(stats.normaltest(resid))fig = plt.figure(figsize=(12,8))ax = fig.add_subplot(111)fig = qqplot(resid, line=‘q‘, ax=ax, fit=True)plt.show()
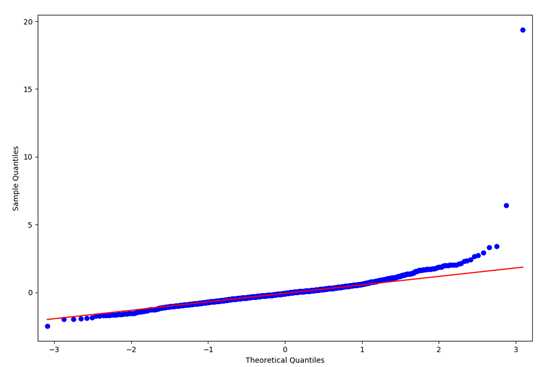
检验:计算得到序列的残差,基本为白噪音
fig = plt.figure(figsize=(12,8))ax1 = fig.add_subplot(211)fig = sm.graphics.tsa.plot_acf(resid.values.squeeze(), lags=40, ax=ax1)ax2 = fig.add_subplot(212)fig = sm.graphics.tsa.plot_pacf(resid, lags=40, ax=ax2)plt.show()
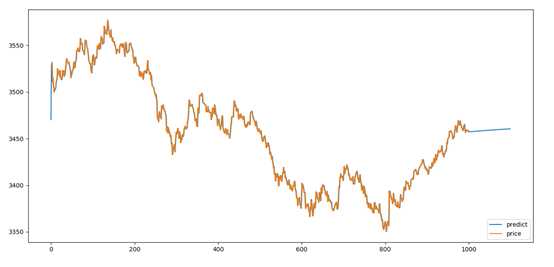
用自回归拟合的模型进行预测,结果如下:
fig=plt.figure(figsize=(15,7))price2=strike_info=history_n(symbol=‘CFFEX.IF1808‘,frequency=‘60s‘,end_time=‘2018-07-01‘,fields=‘symbol,close,frequency,cum_volume‘,count=1000,df=True)[‘close‘]price3=strike_info=history_n(symbol=‘CFFEX.IF1808‘,frequency=‘60s‘,end_time=now,fields=‘symbol,close,frequency,cum_volume‘,count=1000,df=True)[‘close‘]print len(price2)fit = arma_mod80.predict(0, 1100)plt.plot(range(1100),fit[:1100],label=‘predict‘)plt.plot(price2,label=‘price‘)plt.legend(loc=4)plt.show()
用python对股票期货做时序分析
相关内容
- Python怎么识别文字?正确 的方法详解,,爬虫&mdash
- python练习 函数3,,习题:用lambda
- python3的实例方法,,1. 语法class
- python2和python3差异,, 基于python3
- python中的类中属性元素加self.和不加self.的区别,,在类
- python中的numpy常用方法,,numpy是用于处理
- 最火Python3 玩转实用小工具,,第1章 课程介绍介绍
- 【Python3爬虫】使用云打码识别验证码,,本来是学着使
- python编程中的if __name__ == 'main': 的作用和原
- 使用python处理selenium中的获取元素属性问题,,# 获取我
评论关闭