python基础教程总结15——2 画幅好画,,要求:从Intern
python基础教程总结15——2 画幅好画,,要求:从Intern
要求:从Internet上下载数据文件; 分析数据文件并提取感兴趣的部分
工具:图形生成包(ReportLab,PYX等)
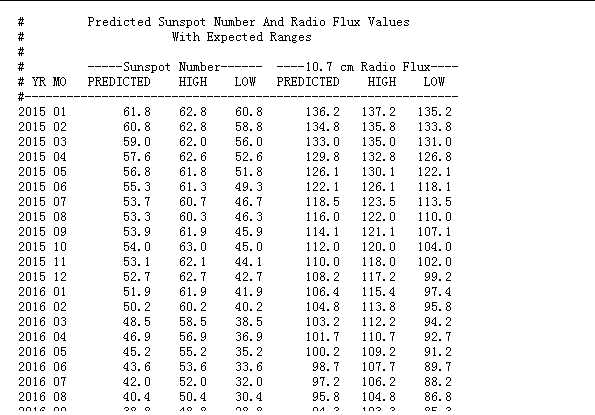
数据:太阳黑子和射电辐射流量(http://services.swpc.noaa.gov/text/predicted-sunspot-radio-flux.txt)
1. 简单实现
1.1 用ReportLab画图
将字符串“Hello world”画在一个100*100像素的大小的PDF图形中间:创建一个给定大小的图纸(drawing);然后创建带有某些属性的图形元素,本例是一个string对象;接着将元素添加到图纸中去;最后将图纸生成为PDF格式并保存。
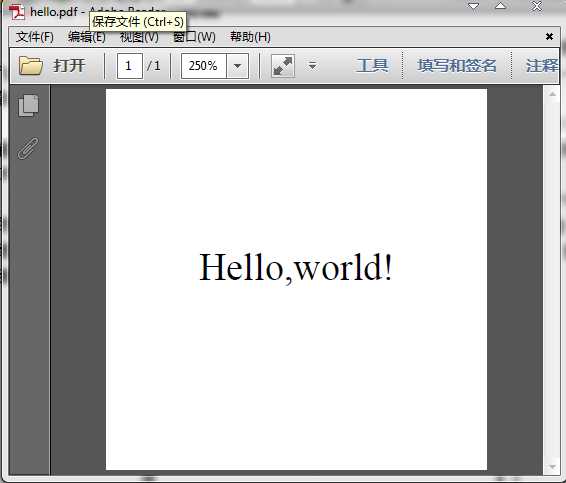
from reportlab.graphics.shapes import Drawing ,Stringfrom reportlab.graphics import renderPDFd=Drawing(100,100)s=String(50,50,‘Hello,world!‘,textAnchor=‘middle‘)d.add(s)renderPDF.drawToFile(d,‘hello.pdf‘,‘A simple PDF file‘)
1.2 原型
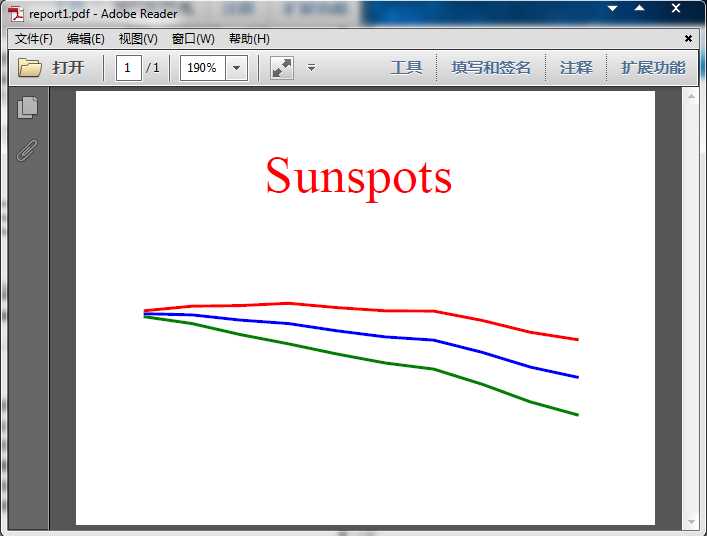
from reportlab.lib import colorsfrom reportlab.graphics.shapes import*from reportlab.graphics import renderPDFdata=[ # Year Month Predicted High Low (2007, 8, 113.2, 114.2, 112.2), (2007, 9, 112.8, 115.8, 109.8), (2007, 10, 111.0, 116.0, 106.0), (2007, 11, 109.8, 116.8, 102.8), (2007, 12, 107.3, 115.3, 99.3), (2008, 1, 105.2, 114.2, 96.2), (2008, 2, 104.1, 114.1, 94.1), (2008, 3, 99.9, 110.9, 88.9), (2008, 4, 94.8, 106.8, 82.8), (2008, 5, 91.2, 104.2, 78.2) ]drawing=Drawing(200,150)pred=[row[2]-40 for row in data]high=[row[3]-40 for row in data]low=[row[4]-40 for row in data]times=[200*((row[0]+row[1]/12.0)-2007)-110 for row in data]#PolyLine画折线drawing.add(PolyLine(zip(times,pred),strokeColor=colors.blue))drawing.add(PolyLine(zip(times,high),strokeColor=colors.red))drawing.add(PolyLine(zip(times,low),strokeColor=colors.green))drawing.add(String(65,115,‘Sunspots‘,fontSize=18,fillColor=colors.red))renderPDF.drawToFile(drawing,‘report1.pdf‘,‘Sunsports‘)
2. 再次实现
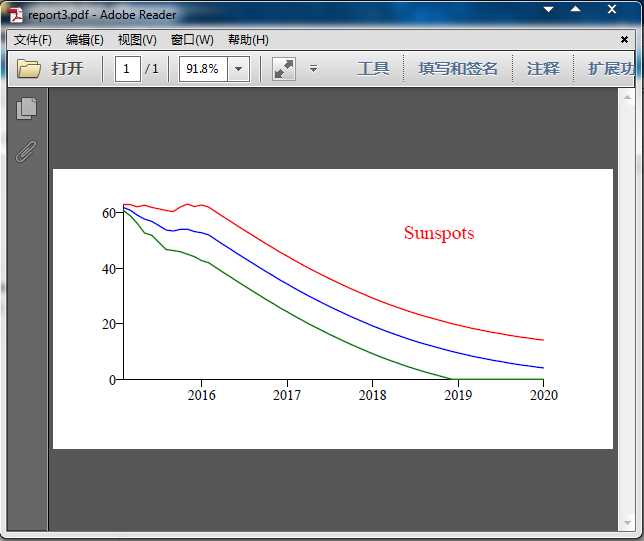
1)获取数据
使用标准模块urllib可以从Internet获取文件。模块中的urlopen函数类似于open函数,参数是一个URL而不是文件名。打开阅读文件时,需要过滤掉不需要的内容。文件包含空行以及每行都以一些特殊的字符开始(#和:),应该忽略。
#URL保存在变量URL中,变量COMMENT_CHARS设定为字符串‘#:‘data=[]for line in urlopen(URL).readlines(): if not line.isspace() and not line[0] in COMMENT_CHARS: data.append([float(n) for n in line.split() ])
2)使用LinePlot类
LinePlot类的实例化不需要任何参数,然后在将它添加到Drawing前设置特性:想,一,height,width以及data(元组列表)
3)最终程序:
from urllib import urlopenfrom reportlab.graphics.shapes import *from reportlab.graphics.charts.lineplots import LinePlotfrom reportlab.graphics.charts.textlabels import Labelfrom reportlab.graphics import renderPDFURL = ‘http://services.swpc.noaa.gov/text/predicted-sunspot-radio-flux.txt‘COMMENT_CHARS = ‘#:‘drawing = Drawing(400, 200)data = []for line in urlopen(URL).readlines(): if not line.isspace() and not line[0] in COMMENT_CHARS: data.append([float(n) for n in line.split()])pred = [row[2] for row in data]high = [row[3] for row in data]low = [row[4] for row in data]times = [row[0] + row[1]/12.0 for row in data]lp = LinePlot()lp.x = 50lp.y = 50lp.height = 125lp.width = 300lp.data = [zip(times, pred),zip(times,high),zip(times, low)]lp.lines[0].strokeColor = colors.bluelp.lines[1].strokeColor = colors.redlp.lines[2].strokeColor = colors.greendrawing.add(lp)drawing.add(String(250,150, ‘Sunspots‘,fontSize=14,fillColor=colors.red))renderPDF.drawToFile(drawing, ‘report3.pdf‘,‘Sunspots‘)
python基础教程总结15——2 画幅好画
相关内容
- 暂无相关文章
评论关闭