【小白Python学习】成绩雷达图,, 1 import
【小白Python学习】成绩雷达图,, 1 import
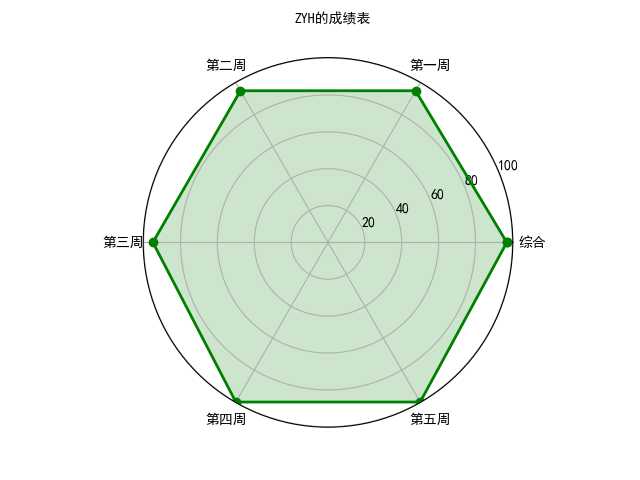
1 import numpy as np 2 import matplotlib.pyplot as plt 3 import matplotlib 4 matplotlib.rcParams[‘font.family‘]=‘SimHei‘ 5 matplotlib.rcParams[‘font.sans-serif‘]=[‘SimHei‘] 6 labels=np.array([‘综合‘,‘第一周‘,‘第二周‘,‘第三周‘,‘第四周‘,‘第五周‘]) 7 nAttr=6 8 Python=np.array([97,95,95,95,100,100]) 9 angles=np.linspace(0,2*np.pi,nAttr,endpoint=False)10 Python=np.concatenate((Python,[Python[0]]))11 angles=np.concatenate((angles,[angles[0]]))12 fig=plt.figure(facecolor="white")13 plt.subplot(111,polar=True)14 plt.plot(angles,Python,‘bo-‘,color=‘g‘,linewidth=2)15 plt.fill(angles,Python,facecolor=‘g‘,alpha=0.2)16 plt.thetagrids(angles*180/np.pi,labels)17 plt.figtext(0.52,0.95,‘ZYH的成绩表‘,ha=‘center‘)18 plt.grid(True)19 plt.savefig(‘ZYH.JPG‘)20 plt.show()
【小白Python学习】成绩雷达图
相关内容
- python_面向对象——对象之间的关联关系,,1.将类中的对
- Python网络编程_TCP(简略版),,TCP监听套接字:
- Behave + Selenium(Python) ------ (第四篇),,最近比较忙, be
- Python文件操作大全,,Python 编程文
- Python实战练习——打印日历教程,,很长一段时间没有接
- python中的多线程【转】,,转载自:http:/
- Python基础教程总结(二),, 上周总结了一下P
- 用Python爬取28010条《隐秘的角落》评论,有没发现点什
- python常见报错信息!错误和异常!附带处理方法,,作为
- Python画三维图-----插值平滑数据,,一、二维的插值方法
评论关闭