Python中matplotlib中文乱码解决办法,
Python中matplotlib中文乱码解决办法,
Matplotlib是Python的一个很好的绘图包,但是其本身并不支持中文(貌似其默认配置中没有中文字体),所以如果绘图中出现了中文,就会出现乱码。
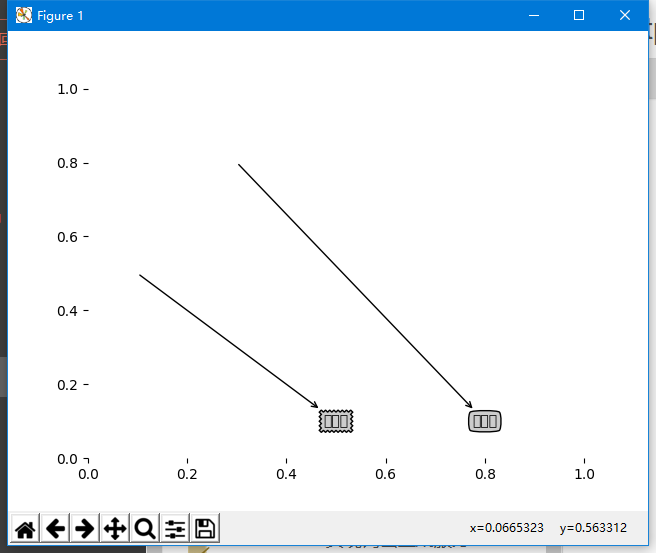
matplotlib绘制图像有中文标注时会有乱码问题。
实例代码:
import matplotlib
import matplotlib.pyplot as plt

#定义文本框和箭头格式
decisionNode =dict(boxstyle="sawtooth",fc="0.8")
leafNode=dict(boxstyle="round4",fc="0.8")
arrow_args=dict(arrowstyle="<-")

#绘制带箭头的注解
def plotNode(nodeTxt,centerPt,parentPt,nodeType):
  createPlot.axl.annotate(nodeTxt,xy=parentPt,xycoords='axes fraction',xytext=centerPt,textcoords='axes fraction',va="center",ha="center",bbox=nodeType,arrowprops=arrow_args)

def createPlot():
  fig =plt.figure(1,facecolor='white')
  fig.clf()
  createPlot.axl=plt.subplot(111,frameon=False)
  plotNode(U'决策点',(0.5,0.1),(0.1,0.5),decisionNode)
  plotNode(U'叶节点',(0.8,0.1),(0.3,0.8),leafNode)
  plt.show()
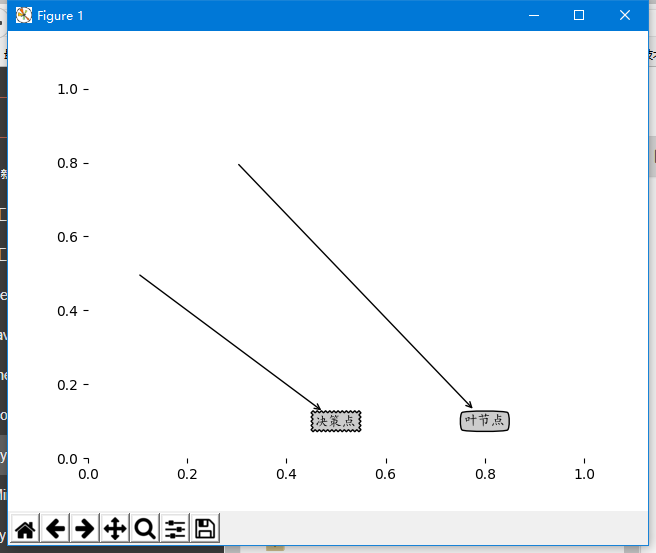
解决办法:代码中引入字体
import matplotlib.pyplot as plt
import matplotlib

#定义自定义字体,文件名是系统中文字体
myfont = matplotlib.font_manager.FontProperties(fname='C:/Windows/Fonts/simkai.ttf')
#解决负号'-'显示为方块的问题
matplotlib.rcParams['axes.unicode_minus']=False

decisionNode =dict(boxstyle="sawtooth",fc="0.8")
leafNode=dict(boxstyle="round4",fc="0.8")
arrow_args=dict(arrowstyle="<-")

def plotNode(nodeTxt,centerPt,parentPt,nodeType):
  createPlot.axl.annotate(nodeTxt,xy=parentPt,xycoords='axes fraction',xytext=centerPt,textcoords='axes fraction',va="center",ha="center",bbox=nodeType,arrowprops=arrow_args,fontproperties=myfont)

def createPlot():
  fig =plt.figure(1,facecolor='white')
  fig.clf()
  createPlot.axl=plt.subplot(111,frameon=False)
  plotNode(U'决策点',(0.5,0.1),(0.1,0.5),decisionNode)
  plotNode(U'叶节点',(0.8,0.1),(0.3,0.8),leafNode)
  plt.show()
以上就是本文的全部内容,希望对大家的学习有所帮助,也希望大家多多支持帮客之家。
相关内容
- python使用matplotlib绘图时图例显示问题的解决,pythonma
- Python利用matplotlib生成图片背景及图例透明的效果,
- 利用matplotlib+numpy绘制多种绘图的方法实例,matplotlibn
- 利用numpy+matplotlib绘图的基本操作教程,numpymatplotlib
- python使用matplotlib绘制柱状图教程,pythonmatplotlib
- python利用matplotlib库绘制饼图的方法示例,pythonmatplotl
- 解决python2.7 查询mysql时出现中文乱码,
- Windows下为Python安装Matplotlib模块,pythonmatplotlib
- 在Linux下使用Python的matplotlib绘制数据图的教程,python
- Python实现在matplotlib中两个坐标轴之间画一条直线光标的
评论关闭