[Python] Python 学习 - 可视化数据操作(一),python可视化,Python 学习
[Python] Python 学习 - 可视化数据操作(一),python可视化,Python 学习
Python 学习 - 可视化数据操作(一)
GitHub:https://github.com/liqingwen2015/my_data_view
目录
折线图散点图随机漫步骰子点数概率文件目录折线图
cube_squares.py
import matplotlib.pyplot as pltx_values=list(range(1, 5000))y_values=[pow(x, 3) for x in x_values]plt.scatter(x_values, y_values, c=y_values, cmap=plt.cm.Blues, edgecolor=‘none‘, s=40)# 设置标题和样式plt.title("Square Numbers", fontsize=24)plt.xlabel("Value", fontsize=14)plt.ylabel("Square of Value", fontsize=14)# 设置刻度标记的大小plt.tick_params(axis=‘both‘, which=‘major‘, labelsize=14)plt.show()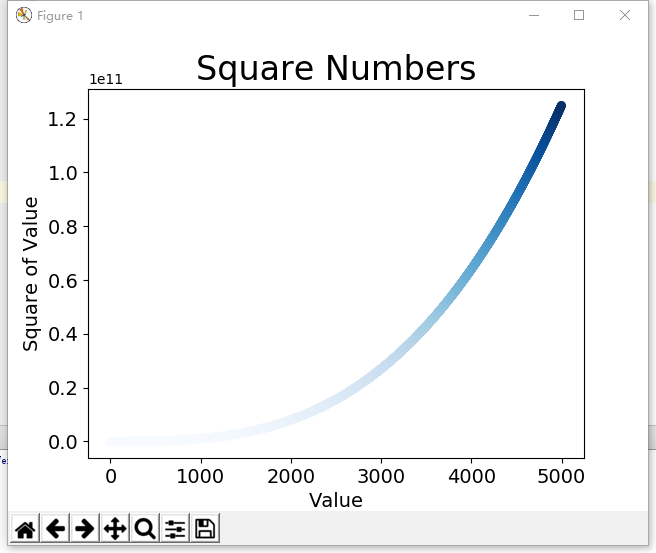
mpl_squares.py
# 简单的折线图
import matplotlib.pyplot as pltinput_values=[1, 2, 3, 4, 5 ]squares = [1, 4, 9, 16, 25]# 绘制线条的粗细plt.plot(input_values, squares, linewidth=5)# 设置图表标题,并给坐标轴加上标签plt.title("Square Numbers", fontsize=24)plt.xlabel("Value", fontsize=14)plt.ylabel("Square of Value", fontsize=14)# 设置刻度标记的大小,axis=‘both‘ 表示指定的实参影响 x 轴和 y 轴上的刻度plt.tick_params(axis=‘both‘, labelsize=14)plt.show()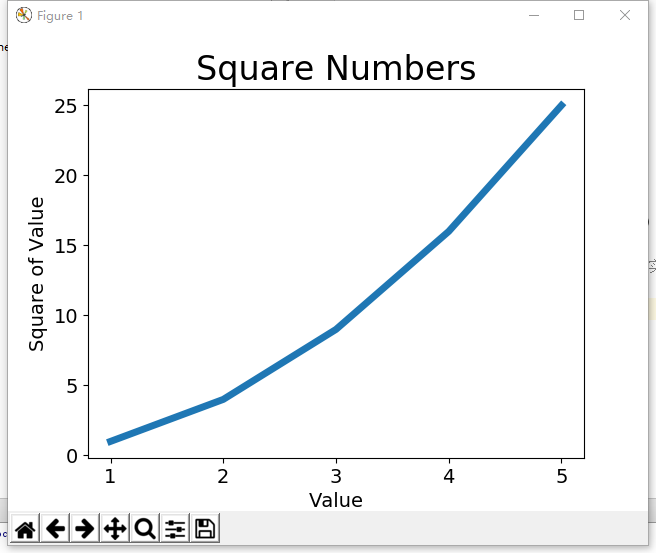
散点图
scatter_squares.py
# 散点图import matplotlib.pyplot as pltx_values = list(range(1, 1001))y_values = [x**2 for x in x_values]# c:颜色#plt.scatter(x_values, y_values, c=‘red‘, edgecolor=‘none‘, s=40)#plt.scatter(x_values, y_values, c=(0, 0, 8), edgecolor=‘none‘, s=40)plt.scatter(x_values, y_values, c=y_values, cmap=plt.cm.Blues, edgecolor=‘none‘, s=40)# 设置标题和样式plt.title("Square Numbers", fontsize=24)plt.xlabel("Value", fontsize=14)plt.ylabel("Square of Value", fontsize=14)# 设置刻度标记的大小plt.tick_params(axis=‘both‘, which=‘major‘, labelsize=14)plt.show()# 保存图表#plt.savefig(‘squared_plot.png‘, bbox_inches=‘tight‘)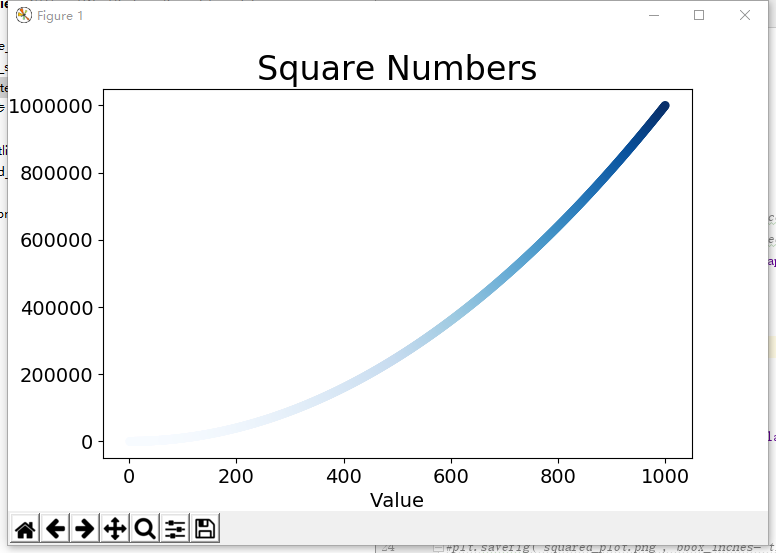
随机漫步
random_walk.py
from random import choiceclass RandomWalk(): def __init__(self, num_points=5000): # 初始化随机漫步的属性 self.num_points = num_points # 所有随机漫步都始于(0, 0) self.x_values = [0] self.y_values = [0] def fill_walk(self): # 不断漫步,直到列表达到指定的长度 while len(self.x_values) < self.num_points: x_step = self.get_step(); y_step = self.get_step(); # 拒绝原地踏步 if x_step == 0 and y_step == 0: continue # 计算下一个点的 x 和 y 值 next_x = self.x_values[-1] + x_step next_y = self.y_values[-1] + y_step self.x_values.append(next_x) self.y_values.append(next_y) def get_step(self): # 决定前进方向以及沿这个方向前进的距离 direction = choice([1, -1]) # 随机选 1 或 -1 distance = choice([0, 1, 2, 3, 4]) # 随机选 0, 1, 2, 3, 4 return direction * distance # 正数:右移,负数:左移
rw_visual.py
import matplotlib.pyplot as pltfrom 随机漫步.random_walk import RandomWalkwhile True: # 创建一个 RandomWalk 实例,并将其包含的点都绘制出来 rw = RandomWalk(5000) rw.fill_walk() point_numbers = list(range(rw.num_points)) plt.scatter(rw.x_values, rw.y_values, c=point_numbers, cmap=plt.cm.Blues, edgecolors=‘none‘, s=1) # 设置绘图窗口的尺寸 #plt.figure(dpi=128, figsize=(10, 6)) # 突出起点和终点 plt.scatter(0, 0, c=‘green‘, edgecolors=‘none‘, s=100) plt.scatter(rw.x_values[-1], rw.y_values[-1], c=‘red‘, edgecolors=‘none‘, s=100) #plt.plot(rw.x_values, rw.y_values, linewidth=10) # 隐藏坐标轴 plt.axes().get_xaxis().set_visible(False) plt.axes().get_yaxis().set_visible(False) plt.show() keep_running = input("继续?(y/n):") if keep_running == ‘n‘: break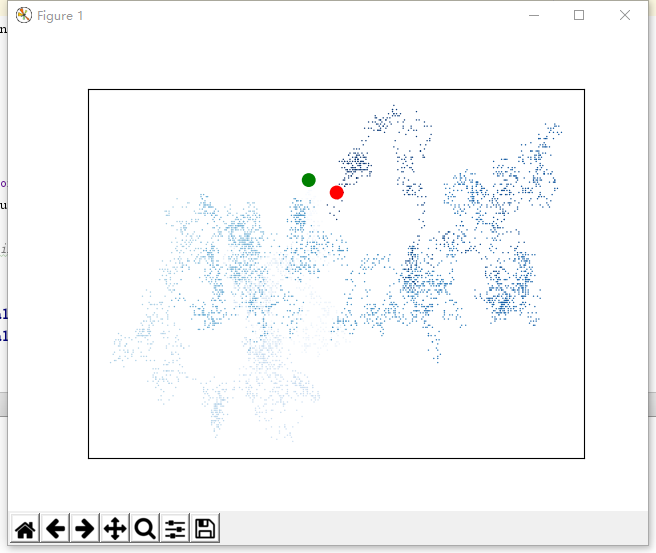
骰子点数概率
die.py
from random import randintclass Die(): # 表示一个骰子类 def __init__(self, num_sides=6): # 6 面 self.num_sides = num_sides def roll(self): # 返回 1~6 return randint(1, self.num_sides)
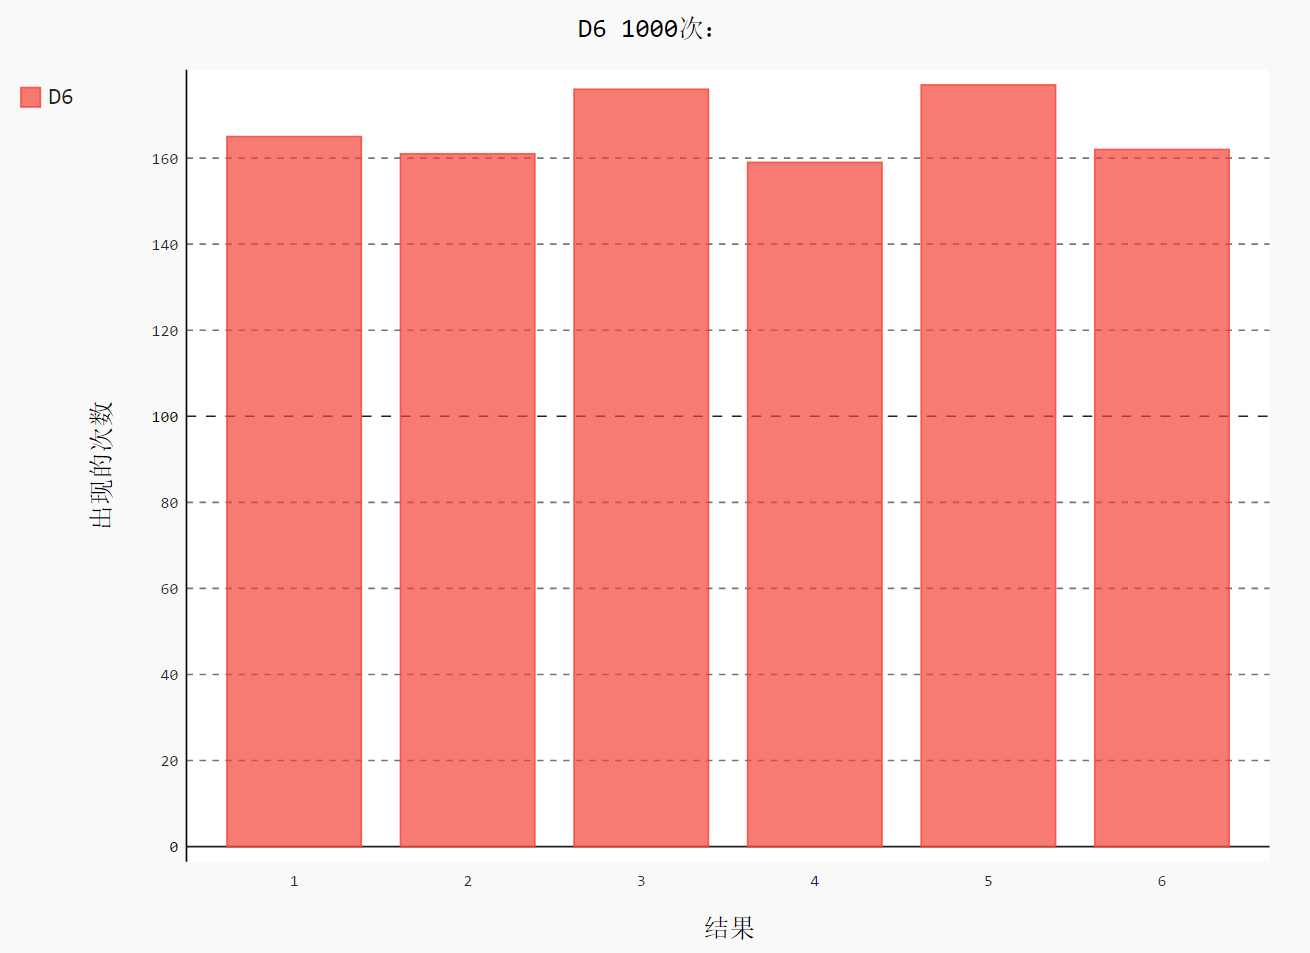
die_visual.py
import pygalfrom 骰子.die import Die# 创建一个 D6die = Die()results = []for roll_num in range(1000): result = die.roll() results.append(result)frequencies = []for value in range(1, die.num_sides+1): # 计算某个值出现同样的次数 frequency = results.count(value) frequencies.append(frequency)# 对结果进行可视化hist = pygal.Bar()hist.title = "D6 1000次:"hist.x_labels = [str(num) for num in range(1, 7)] #[‘1‘, ‘2‘, ‘3‘, ‘4‘, ‘5‘, ‘6‘]hist.x_title = "结果"hist.y_title = "概率"hist.add(‘D6‘, frequencies)hist.render_to_file(‘images/die_visual.svg‘)
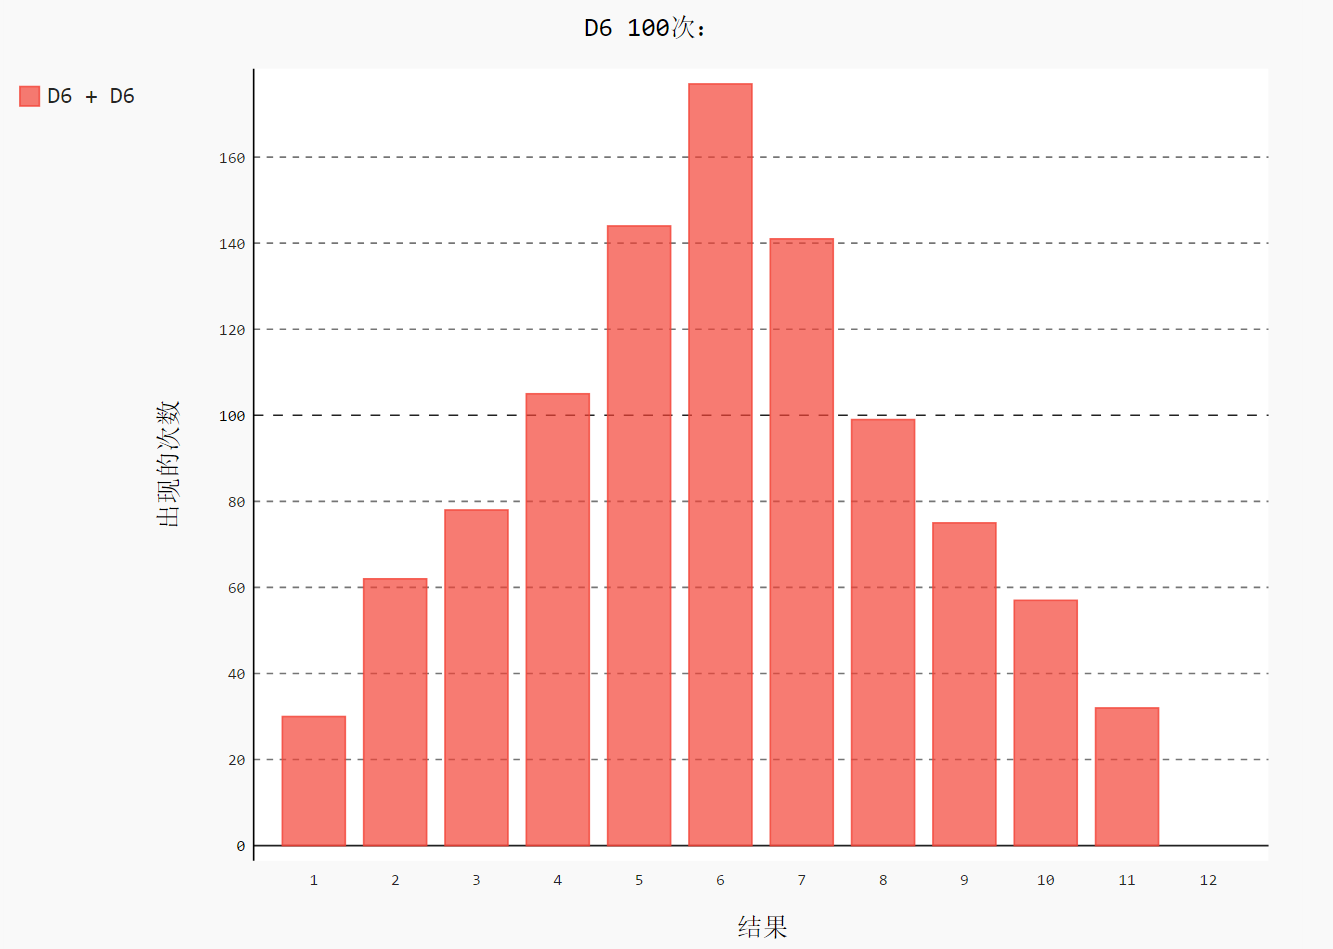
dice_visual.py
import pygalfrom 骰子.die import Die# 创建 2 个 D6die_1 = Die()die_2 = Die()results = []for roll_num in range(1000): result = die_1.roll() + die_2.roll() results.append(result)frequencies = []max_results = die_1.num_sides + die_2.num_sidesfor value in range(2, max_results+1): # 计算某个值出现同样的次数 frequency = results.count(value) frequencies.append(frequency)# 对结果进行可视化hist = pygal.Bar()hist.title = "D6 100次:"hist.x_labels = [str(num) for num in range(1, 13)] #[‘1‘, ‘2‘, ‘3‘, ‘4‘, ‘5‘, ‘6‘, ‘7‘, ‘8‘, ‘9‘, ‘10‘, ‘11‘, ‘12‘]hist.x_title = "结果"hist.y_title = "出现的次数"hist.add(‘D6 + D6‘, frequencies)hist.render_to_file(‘images/dice_visual.svg‘)
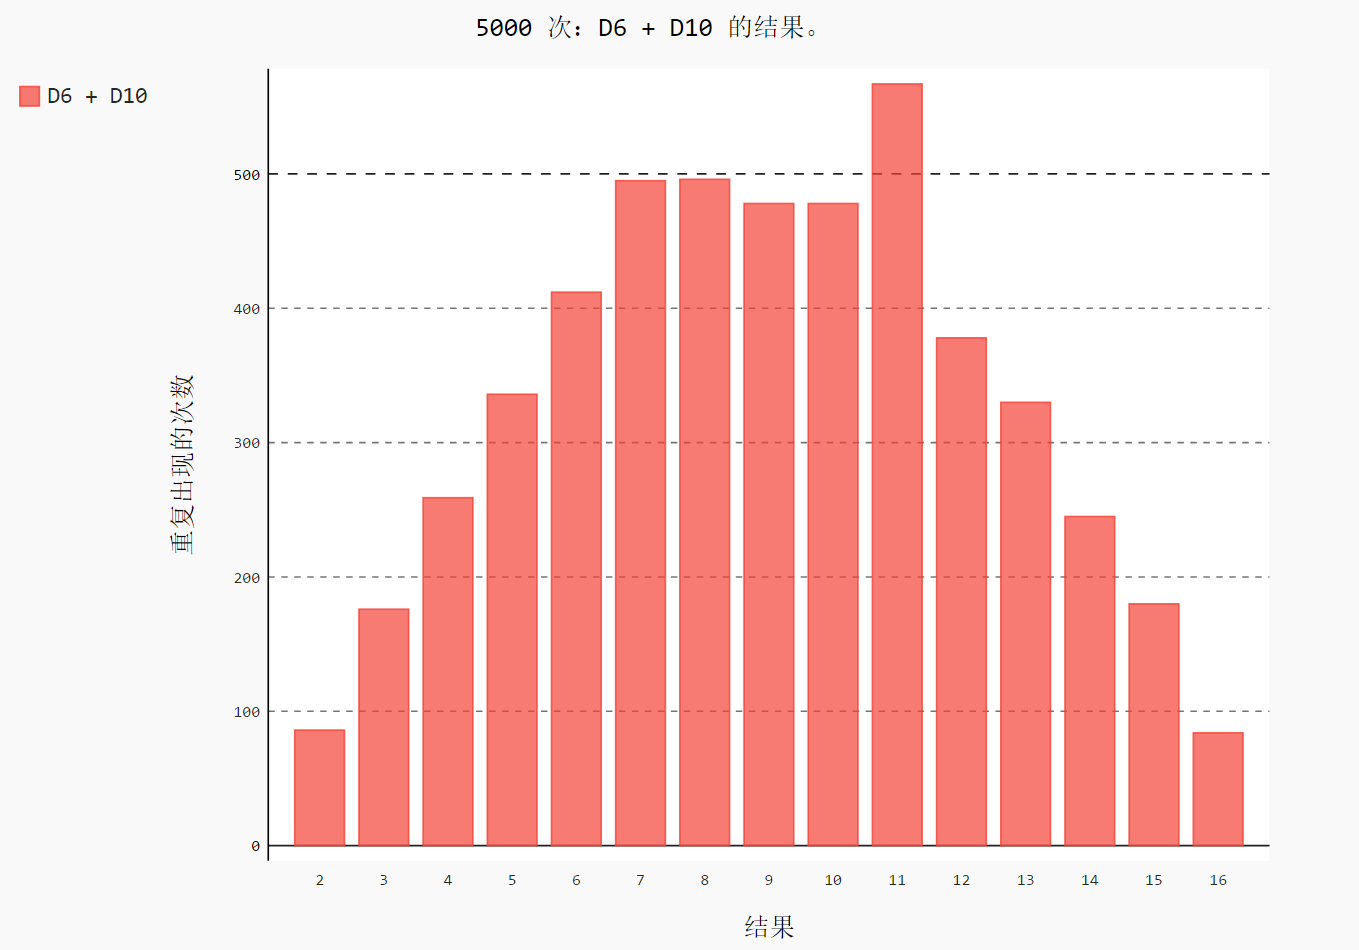
different_dice.py
import pygalfrom 骰子.die import Die# 创建一个 D6 和 D10die_1 = Die()die_2 = Die(10)results = []for roll_num in range(5000): result = die_1.roll() + die_2.roll() results.append(result)frequencies = []max_results = die_1.num_sides + die_2.num_sidesfor value in range(2, max_results+1): # 计算某个值出现同样的次数 frequency = results.count(value) frequencies.append(frequency)# 对结果进行可视化hist = pygal.Bar()hist.title = "5000 次:D6 + D10 的结果。"hist.x_labels = [str(num) for num in range(2, 17)]hist.x_title = "结果"hist.y_title = "重复出现的次数"hist.add(‘D6 + D10‘, frequencies)hist.render_to_file(‘images/different_visual.svg‘)
文件目录
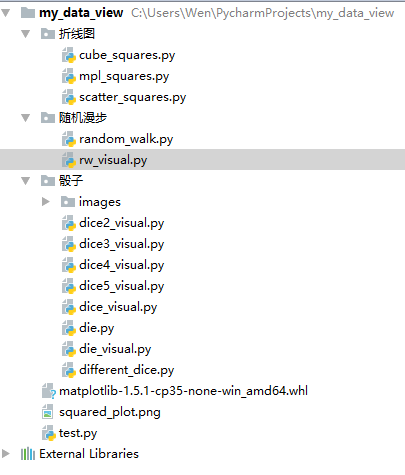
GitHub:https://github.com/liqingwen2015/my_data_view
[Python] Python 学习 - 可视化数据操作(一)
相关内容
- Windows10+Python3下安装NumPy+SciPy+Matplotlib,windows10numpy,Num
- python中文编码&json中文输出问题,,python2.x版
- 利用Python进行数据分析:【Pandas】(Series+DataFrame),
- 基于SVM的python简单实现验证码识别,svmpython验证码,验证
- python+selenium 定位隐藏元素,pythonselenium,定位隐藏要素的
- python+NLTK 自然语言学习处理五:词典资源,pythonnltk,前
- Termux的安装在手机上来运行Python,termuxpython,1. Termux
- python学习(7),python学习,习题7:判断一个数是
- 微信跳一跳python程序,信跳python程序,#源码下载地址:
- Python 二级模拟操作题(一),python模拟,1.计算下列式子
评论关闭