Python3绘图之Matplotlib(03),,饼图 = pie散点
Python3绘图之Matplotlib(03),,饼图 = pie散点
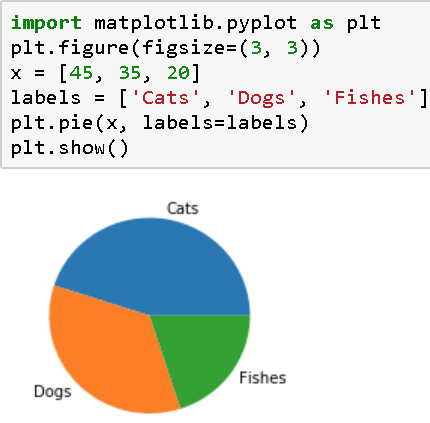
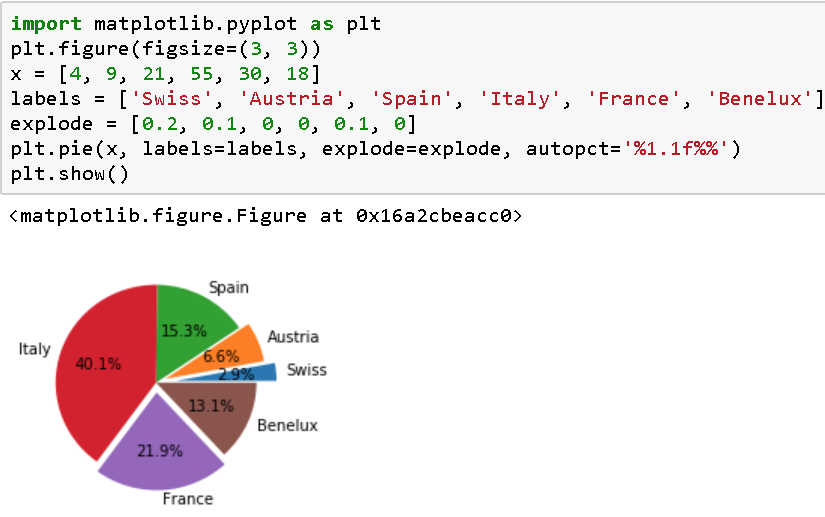
饼图 = pie
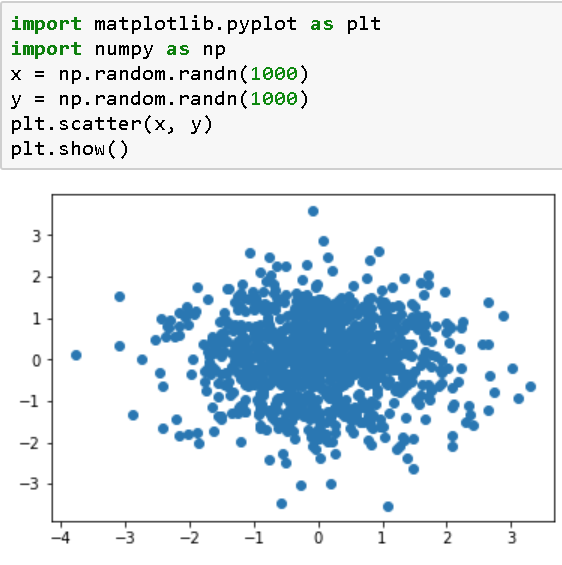
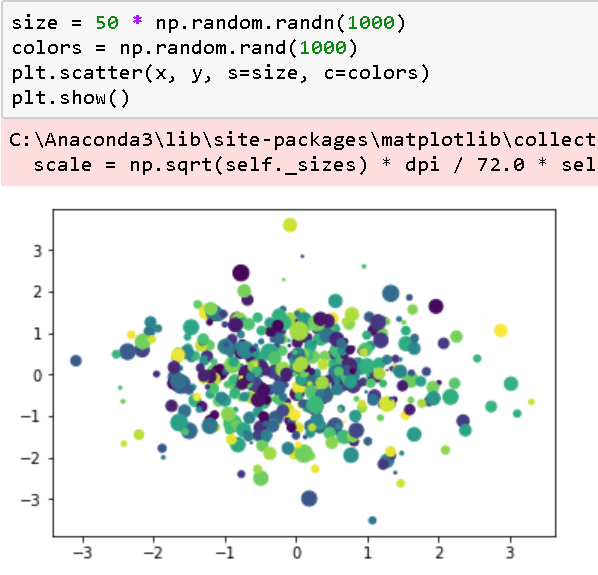
散点图 = scatter plots
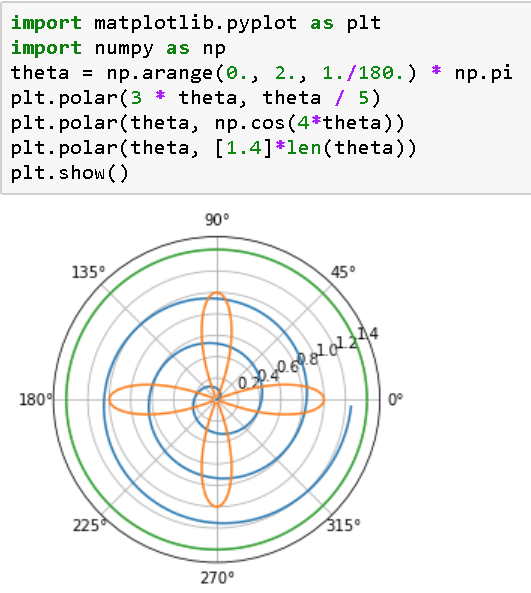
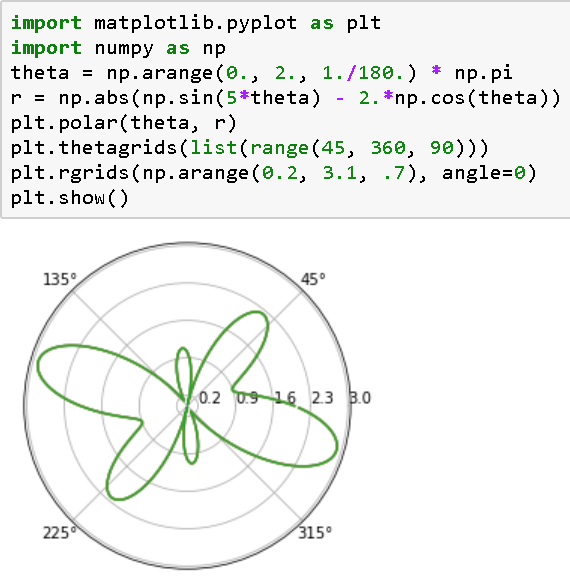
极化图 = polar charts
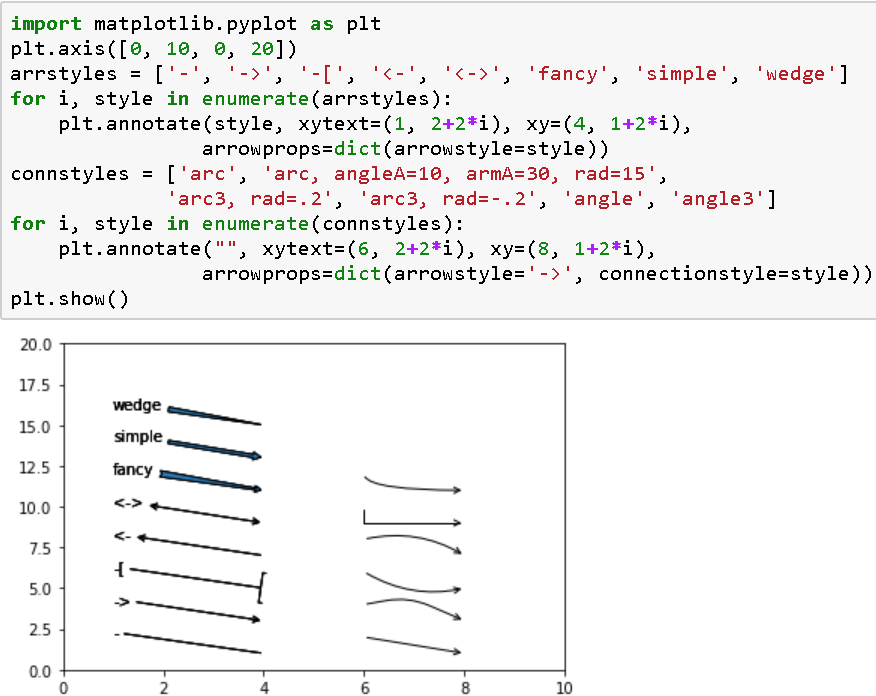
箭头 = Annotations

本节代码示例
import matplotlib.pyplot as pltplt.figure(figsize=(3, 3))x = [45, 35, 20]labels = [‘Cats‘, ‘Dogs‘, ‘Fishes‘]plt.pie(x, labels=labels)plt.show()import matplotlib.pyplot as pltplt.figure(figsize=(3, 3))x = [4, 9, 21, 55, 30, 18]labels = [‘Swiss‘, ‘Austria‘, ‘Spain‘, ‘Italy‘, ‘France‘, ‘Benelux‘]explode = [0.2, 0.1, 0, 0, 0.1, 0]plt.pie(x, labels=labels, explode=explode, autopct=‘%1.1f%%‘)plt.show()# Scatter plotsimport matplotlib.pyplot as pltimport numpy as npx = np.random.randn(1000)y = np.random.randn(1000)plt.scatter(x, y)plt.show()size = 50 * np.random.randn(1000)colors = np.random.rand(1000)plt.scatter(x, y, s=size, c=colors)plt.show()# Polar chartsimport matplotlib.pyplot as pltimport numpy as nptheta = np.arange(0., 2., 1./180.) * np.piplt.polar(3 * theta, theta / 5)plt.polar(theta, np.cos(4*theta))plt.polar(theta, [1.4]*len(theta))plt.show()import matplotlib.pyplot as pltimport numpy as nptheta = np.arange(0., 2., 1./180.) * np.pir = np.abs(np.sin(5*theta) - 2.*np.cos(theta))plt.polar(theta, r)plt.thetagrids(list(range(45, 360, 90)))plt.rgrids(np.arange(0.2, 3.1, .7), angle=0)plt.show()import matplotlib.pyplot as pltimport numpy as npx = np.arange(0, 2*np.pi, .01)y = np.sin(x)plt.plot(x, y)plt.text(0.1, -0.04, ‘sin(0)=0‘)plt.show()# Annotationsimport matplotlib.pyplot as plty = [13, 11, 13, 12, 13, 10, 30, 12, 11, 13, 12, 12, 12, 11, 12]plt.plot(y)plt.ylim(ymax=35)plt.annotate(‘This plot must really\nmean somothing‘, xy=(6, 30), xytext=(8, 31.5), arrowprops=dict(facecolor=‘black‘, shrink=.05))plt.show()import matplotlib.pyplot as pltplt.axis([0, 10, 0, 20])arrstyles = [‘-‘, ‘->‘, ‘-[‘, ‘<-‘, ‘<->‘, ‘fancy‘, ‘simple‘, ‘wedge‘]for i, style in enumerate(arrstyles): plt.annotate(style, xytext=(1, 2+2*i), xy=(4, 1+2*i), arrowprops=dict(arrowstyle=style))connstyles = [‘arc‘, ‘arc, angleA=10, armA=30, rad=15‘, ‘arc3, rad=.2‘, ‘arc3, rad=-.2‘, ‘angle‘, ‘angle3‘]for i, style in enumerate(connstyles): plt.annotate("", xytext=(6, 2+2*i), xy=(8, 1+2*i), arrowprops=dict(arrowstyle=‘->‘, connectionstyle=style))plt.show()Python3绘图之Matplotlib(03)
相关内容
- python接口自动化框架_初级,,1、前提:pytho
- Python3 使用filetype包查找指定目录中所有损坏的文件(图
- windows下使用Python出现No module named tkinter.ttk,,1. 编辑工
- Python-递归函数,,阅读目录: 1、函
- python-面向对象,,面向对象编程——Ob
- Python开发工具PyCharm个性化设置,,Python开发工具
- Python环境搭建之OpenGL,,以下内容为我pyth
- 【python】nuitka封装python,,官网:http://
- 用Python玩微信(非常详细),,代码放在这里:wzy
- python-->GLI,,什么是GLI?Pyt
评论关闭