Python调用GithubAPI并进行初步的数据分析,如何数据分析,找到一个Github
Python调用GithubAPI并进行初步的数据分析,如何数据分析,找到一个Github
找到一个Github上的公开api
url = ‘https://api.github.com/search/repositories?q=language:python&sort=stars‘
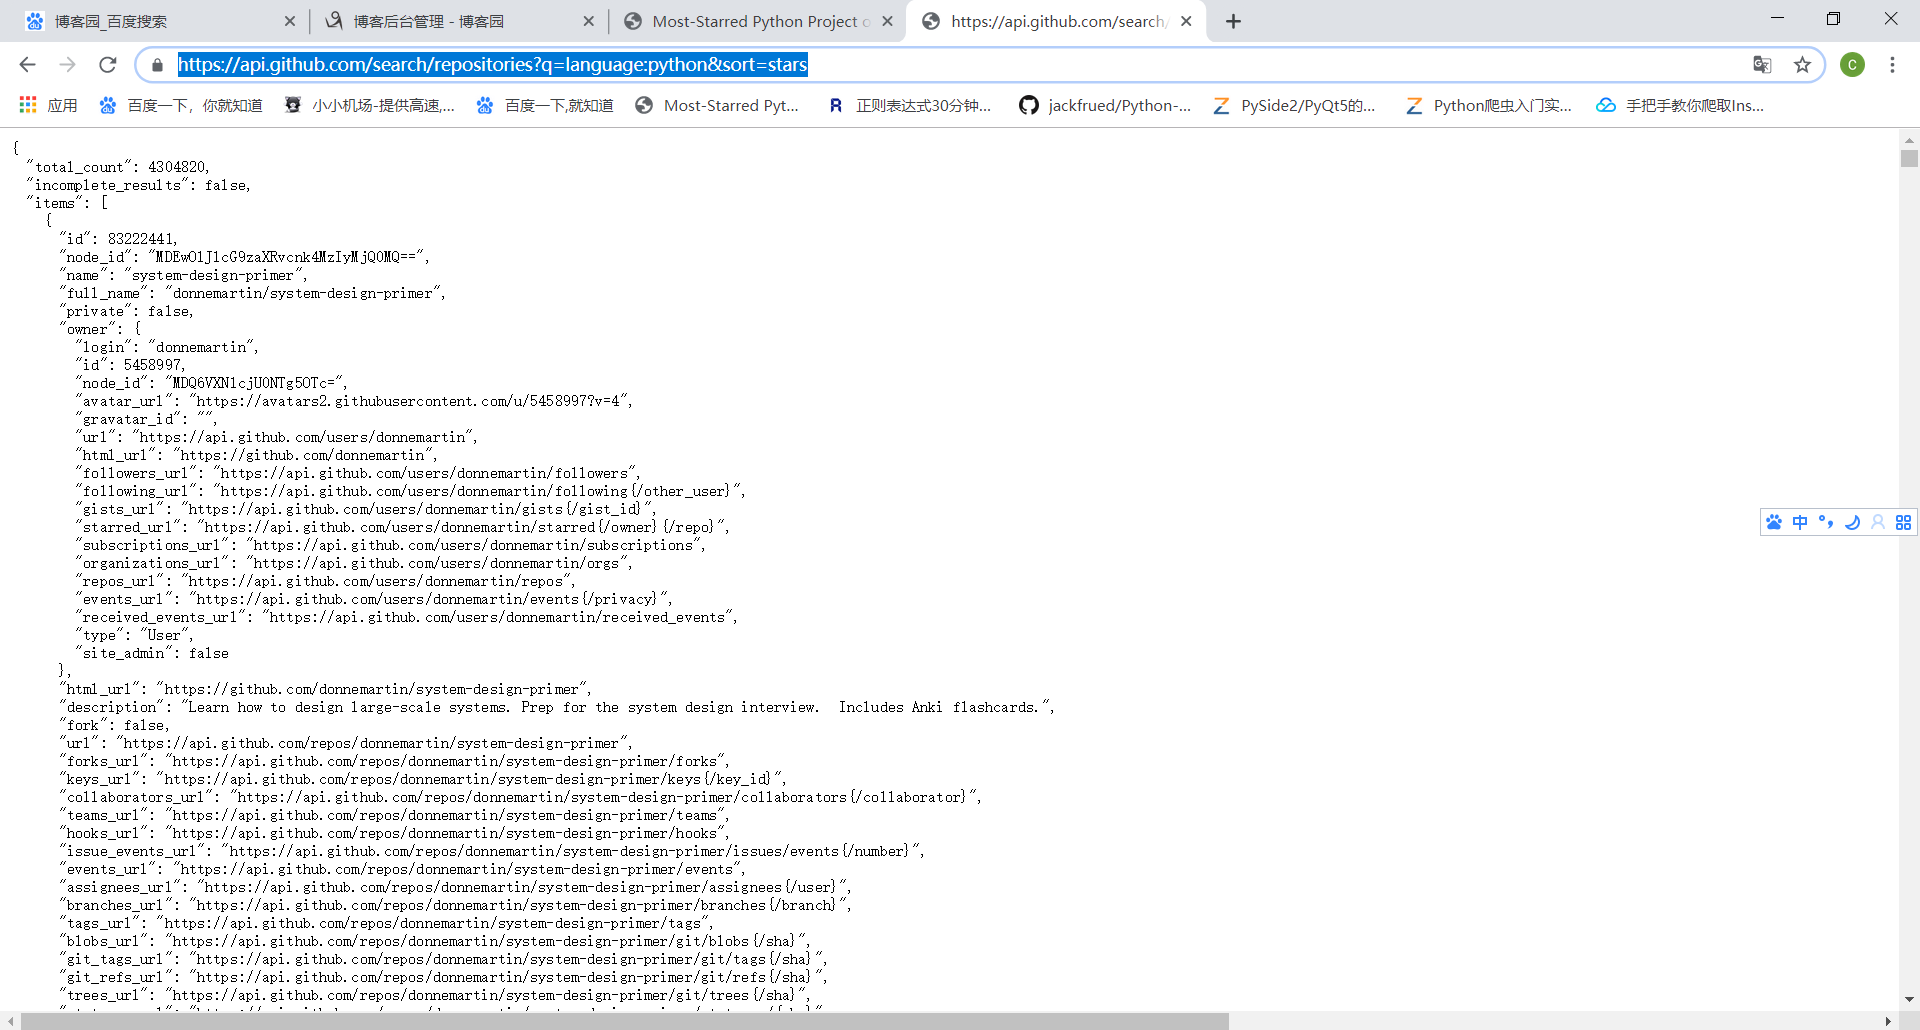
网页内容是一个巨大的Python字典,我们来获取一些信息内容
包括文章所获得星数,文章名,以及文章的链接。
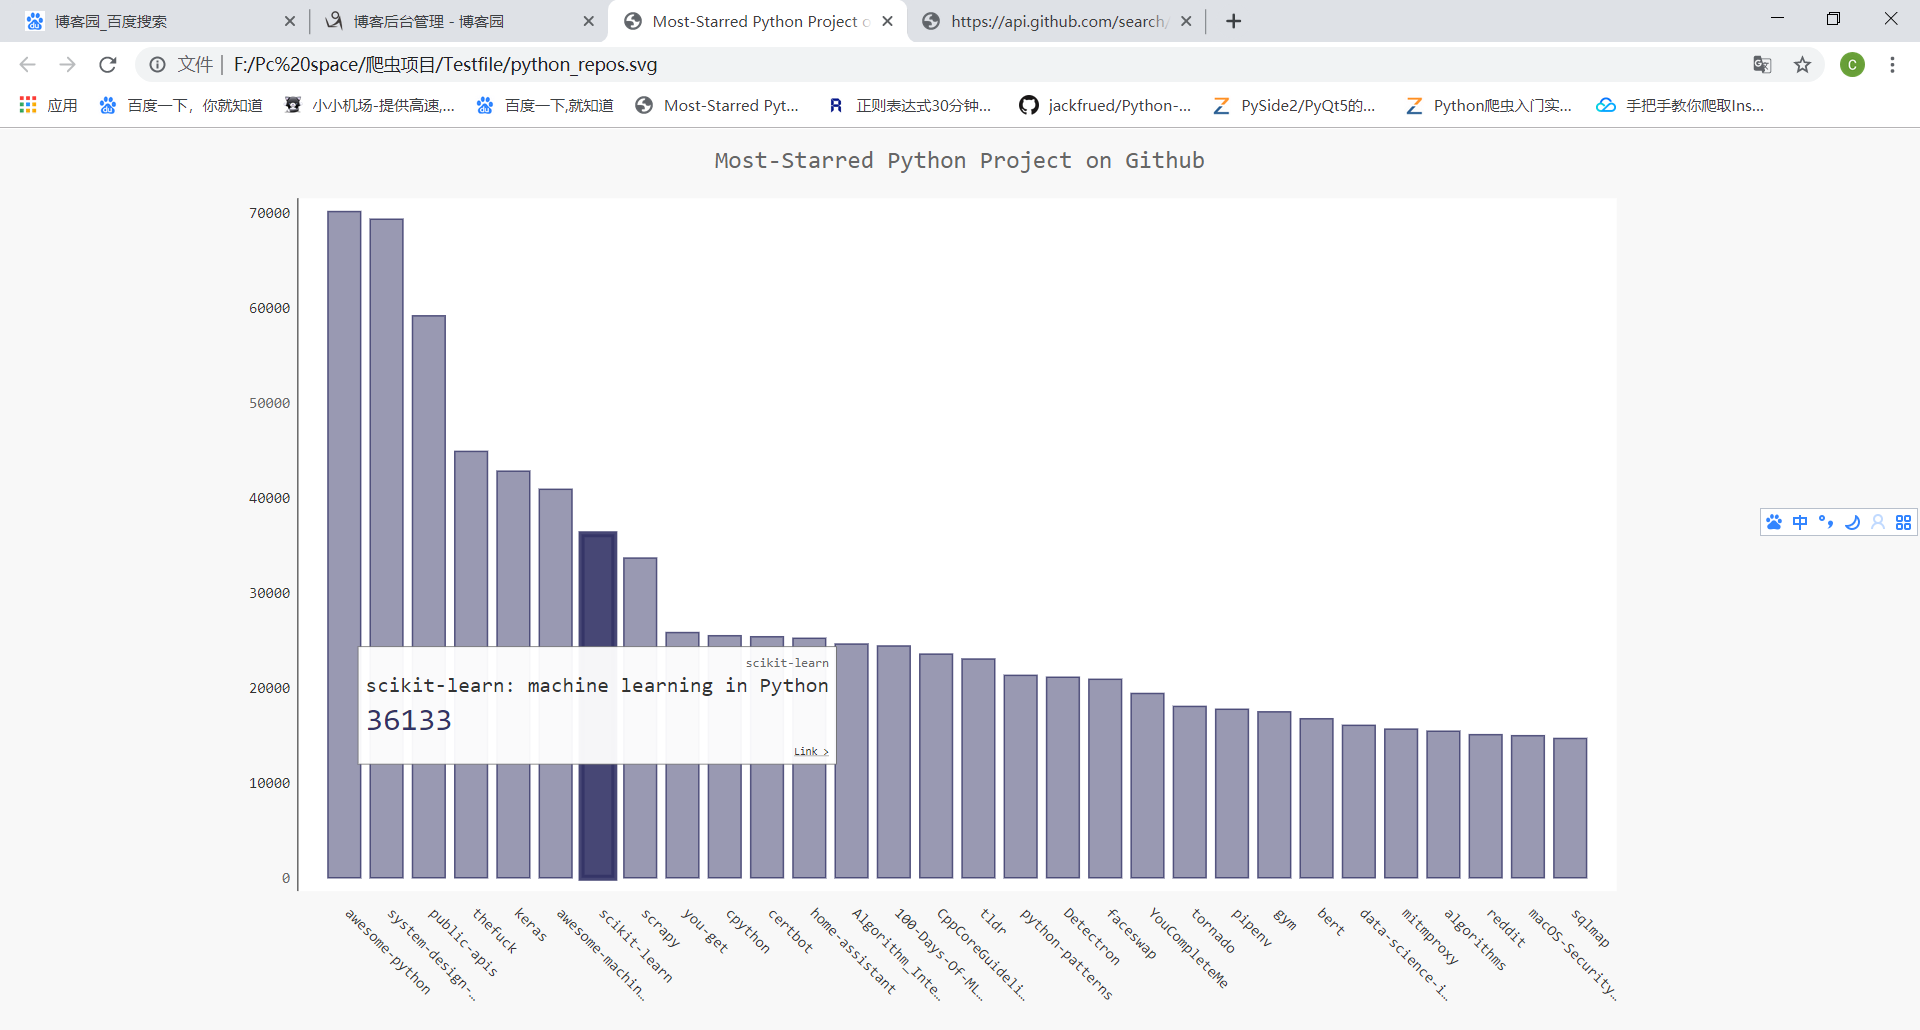
首先,展示一下成品
下面展示具体的操作过程:
首先请求该url
import requestsurl = ‘https://api.github.com/search/repositories?q=language:python&sort=stars‘r = requests.get(url)print("Status Code:" ,r.status_code)输出输出结果为:

说明url请求成功
我们将其json格式化,就获得了之前提到的巨大的json格式的字典
在根据字典的key值,提取对应所需要的value,并将其存入列表。
调用Pygal模块,来将数据进行可视化
以下是具体的实现代码:
import requestsimport pygalfrom pygal.style import  LightColorizedStyle as LCS, LightenStyle as LSurl = ‘https://api.github.com/search/repositories?q=language:python&sort=stars‘r = requests.get(url)print("Status Code:" ,r.status_code)response_dict = r.json()print("Total repositories:" ,response_dict[‘total_count‘])repo_dicts = response_dict[‘items‘]#print("Repositories returned:" ,len(repo_dicts))names, plot_dicts = [], []for repo_dict in repo_dicts:    names.append(repo_dict[‘name‘])  #文章名    if repo_dict[‘description‘]:        plot_dict = {            ‘value‘: repo_dict[‘stargazers_count‘],  #星数            ‘label‘: repo_dict[‘description‘],  #文章描述        }        plot_dicts.append(plot_dict)    else:        plot_dict = {            ‘value‘: repo_dict[‘stargazers_count‘],            ‘label‘: ‘None‘        }        plot_dicts.append(plot_dict)
#格式设置my_style = LS(‘#333366‘,base_style=LCS)  # 333366灰色my_config = pygal.Config()my_config.x_label_rotation = 45my_config.show_legend = Falsemy_config.title_font_size = 24my_config.label_font_size = 14my_config.major_label_font_size = 18my_config.truncate_label = 15my_config.show_y_guides = Falsemy_config.width = 1000chart = pygal.Bar(my_config,style = my_style)chart.title = ‘Most-Starred Python Project on Github‘ chart.x_labels = nameschart.add(‘‘,plot_dicts)chart.render_to_file(‘python_repos.svg‘)
运行过后,会在同目录下生成一个svg文件,里面所呈现的数据包括了星数,文章名,文章简介等。
用浏览器可直接打开,便可以看到条状图成果。
Python调用GithubAPI并进行初步的数据分析
评论关闭