Python处理PDF与CDF,,在拿到数据后,最需要
Python处理PDF与CDF,,在拿到数据后,最需要
在拿到数据后,最需要做的工作之一就是查看一下自己的数据分布情况。而针对数据的分布,又包括pdf和cdf两类。
下面介绍使用python生成pdf和cdf的方法:
使用matplotlib的画图接口hist(),直接画出pdf分布;使用numpy的数据处理函数histogram(),可以生成pdf分布数据,方便进行后续的数据处理,比如进一步生成cdf;使用seaborn的distplot(),好处是可以进行pdf分布的拟合,查看自己数据的分布类型;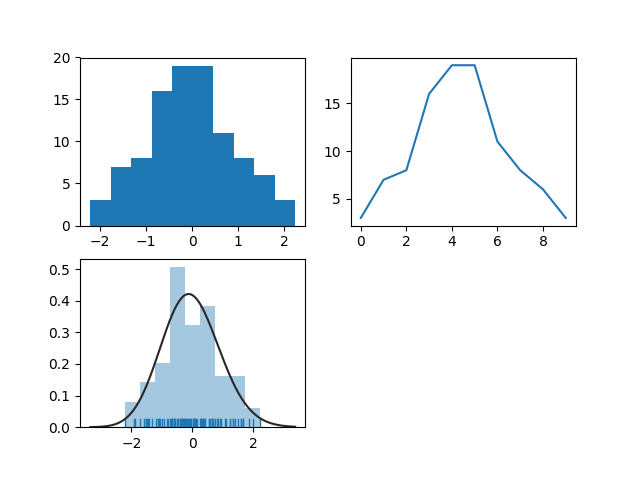
上图所示为采用3种算法生成的pdf图。下面是源代码。
from scipy import statsimport matplotlib.pyplot as pltimport numpy as npimport seaborn as snsarr = np.random.normal(size=100)# plot histogramplt.subplot(221)plt.hist(arr)# obtain histogram dataplt.subplot(222)hist, bin_edges = np.histogram(arr)plt.plot(hist)# fit histogram curveplt.subplot(223)sns.distplot(arr, kde=False, fit=stats.gamma, rug=True)plt.show()
Python处理PDF与CDF
相关内容
- python 实现60甲子,,#!/usr/loc
- python中快速获取本地时区当天0点时间戳的一种方法,
- python 查找日志关键字,,1、抓取出含有关键字
- Python url_escape,,escape.py#
- Python基础教程-第3版(文字版) 超清文字-非扫描版,,此处
- python 写一个scheme解释器(一),,解释器的本质?我们换
- 【Python】itchat,,错误:http://
- python2与python3的区别(持续更新),,1,print(打印
- python_正则表达式,python正则表达式详解,字符组:[]
- python数据分析美国大选项目实战(三),,项目介绍项目
评论关闭