杨韬的Python/Jupyter学习笔记,,杨韬的Python/
杨韬的Python/Jupyter学习笔记,,杨韬的Python/
杨韬的Python/Jupyter学习笔记
Python语法学习 https://zhuanlan.zhihu.com/p/24162430Python 安装库
安装Jupyter Notebook
先安装Pythoncmd 进入K:\Jupyter Notebook Python\Python_3.6.4\Scripts目录cmd 输入 pip install jupyter 开始安装运行 Python_3.6.4\Scripts下的 jupyter-notebook.exe安装numpy 数学包
到https://pypi.python.org/pypi/numpy#downloads 下载对应版本的numpy-1.14.0-cp36-none-win_amd64.whl 文件,复制到Scripts目录下安装
cmd运行 在K:\Jupyter Notebook Python\Python_3.6.4\Scripts>
pip install numpy-1.14.0-cp36-none-win_amd64.whl
安装绘图包matplotlib
cmd 输入 pip install matplotlib安装pandas 数据输入输出库
cmd 输入 pip install pandas安装seaborn绘图库
cmd 输入 pip install seabornpip安装命令
安装 pip install jupyterthemes安装最新版本 pip install --upgrade jupyterthemes安装指定版本 pip install jupyterthemes==0.18.3
实际上pip instal 既可以安装本地.whl 也可以在线安装若在线安装失败,如UnicodeDecodeError: ‘gbk‘ codec can‘t decode 这类问题。可能需要安装之前的指定版本
import math math.sin(3)0.1411200080598672
words = ['cat', 'window', 'defenestrate']for w in words: print("单词 "+w, "长度"+str(len(w)))单词 cat 长度3单词 window 长度6单词 defenestrate 长度12
# 绘图包 matplotlib 的使用# https://liam0205.me/2014/09/11/matplotlib-tutorial-zh-cn/# http://codingpy.com/article/a-quick-intro-to-matplotlib/import matplotlib.pyplot as plt # 需要先包含绘图包 import numpy as npx = np.arange(20)y = x**2plt.plot(x, y)plt.show() # 显示图形#参考 http://codingpy.com/article/a-quick-intro-to-matplotlib/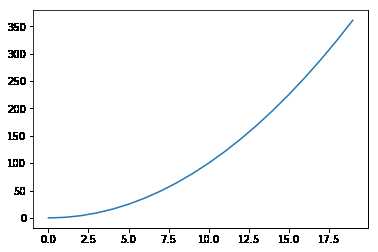
$$ \int_0^{+\infty} x^2 dx $$
# 自定义曲线的外观x = np.linspace(0, 2 * np.pi, 50)plt.plot(x, np.sin(x), 'r-o', x, np.cos(x), 'g--') # r g 颜色 - 线型plt.show()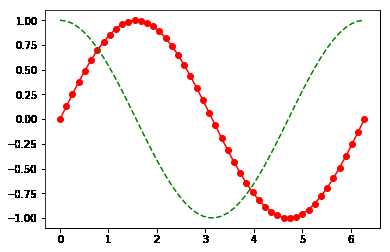
# 彩色映射散点图x = np.random.rand(1000)y = np.random.rand(1000)size = np.random.rand(1000) * 50colour = np.random.rand(1000)plt.scatter(x, y, size, colour) # 散点图plt.colorbar() #颜色栏plt.show()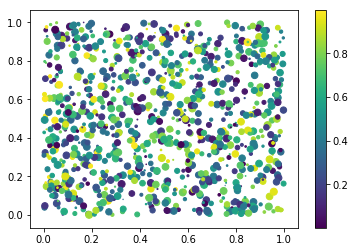
import matplotlib.pyplot as pltimport numpy as npfrom mpl_toolkits.mplot3d import Axes3Dnp.random.seed(42)# 采样个数500n_samples = 500dim = 3# 先生成一组3维正态分布数据,数据方向完全随机samples = np.random.multivariate_normal( np.zeros(dim), np.eye(dim), n_samples)# 通过把每个样本到原点距离和均匀分布吻合得到球体内均匀分布的样本for i in range(samples.shape[0]): r = np.power(np.random.random(), 1.0/3.0) samples[i] *= r / np.linalg.norm(samples[i])upper_samples = []lower_samples = []for x, y, z in samples: # 3x+2y-z=1作为判别平面 if z > 3*x + 2*y - 1: upper_samples.append((x, y, z)) else: lower_samples.append((x, y, z))fig = plt.figure('3D scatter plot')ax = fig.add_subplot(111, projection='3d')uppers = np.array(upper_samples)lowers = np.array(lower_samples)# 用不同颜色不同形状的图标表示平面上下的样本# 判别平面上半部分为红色圆点,下半部分为绿色三角ax.scatter(uppers[:, 0], uppers[:, 1], uppers[:, 2], c='r', marker='o')ax.scatter(lowers[:, 0], lowers[:, 1], lowers[:, 2], c='g', marker='^')plt.show()# 参考 https://zhuanlan.zhihu.com/p/24309547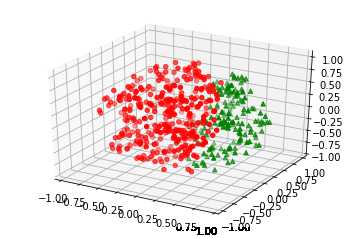
使用pandas数据输入输出库
参考 http://python.jobbole.com/80853/
import pandas as pd df = pd.DataFrame({ 'A' : 1., 'B' : pd.Timestamp('20130102'), 'C' : pd.Series(1, index=list(range(4)), dtype='float32'), 'D' : pd.Series([1, 2, 1, 2], dtype='int32'), 'E' : pd.Categorical(["test", "train", "test", "train"]), 'F' : 'foo' })df| A | B | C | D | E | F | |
|---|---|---|---|---|---|---|
| 0 | 1.0 | 2013-01-02 | 1.0 | 1 | test | foo |
| 1 | 1.0 | 2013-01-02 | 1.0 | 2 | train | foo |
| 2 | 1.0 | 2013-01-02 | 1.0 | 1 | test | foo |
| 3 | 1.0 | 2013-01-02 | 1.0 | 2 | train | foo |
df.B0 2013-01-021 2013-01-022 2013-01-023 2013-01-02Name: B, dtype: datetime64[ns]
使用Seaborn绘图库
Seaborn本质上使用Matplotlib作为核心库,默认情况下就能创建赏心悦目的图
# http://python.jobbole.com/80853/import seaborn as sns # Load one of the data sets that come with seaborntips = sns.load_dataset("tips") sns.jointplot("total_bill", "tip", tips, kind='reg');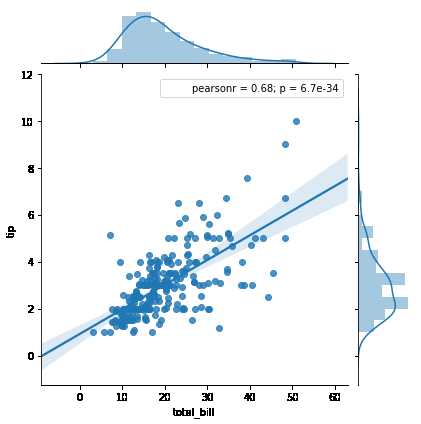
tips.head()| total_bill | tip | sex | smoker | day | time | size | |
|---|---|---|---|---|---|---|---|
| 0 | 16.99 | 1.01 | Female | No | Sun | Dinner | 2 |
| 1 | 10.34 | 1.66 | Male | No | Sun | Dinner | 3 |
| 2 | 21.01 | 3.50 | Male | No | Sun | Dinner | 3 |
| 3 | 23.68 | 3.31 | Male | No | Sun | Dinner | 2 |
| 4 | 24.59 | 3.61 | Female | No | Sun | Dinner | 4 |
sns.lmplot("total_bill", "tip", tips, col="smoker");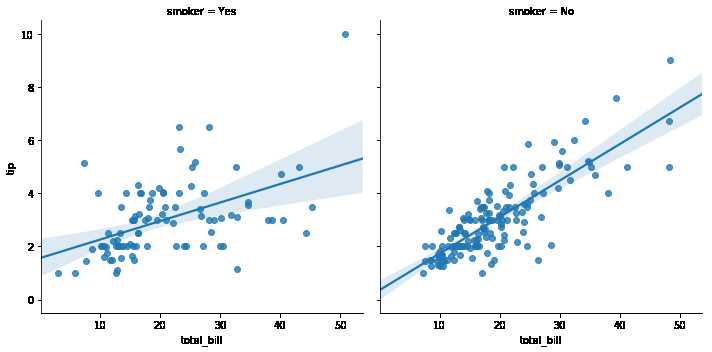
其它参考
http://blog.csdn.net/qq_34264472/article/details/53814653
https://www.cnblogs.com/kylinlin/p/5236601.html
http://blog.csdn.net/u013082989/article/details/73278458
https://www.cnblogs.com/gczr/p/6767175.html
Python·Jupyter Notebook各种使用方法记录
http://blog.csdn.net/tina_ttl/article/details/51031113
Jupyter更换主题
https://github.com/dunovank/jupyter-themes
安装主题
pip install jupyterthemes若出现UnicodeDecodeError: ‘gbk‘ 中文问题,可安装之前的版本
pip install jupyterthemes==0.18.3
查看已安装带主题
命令行 jt -l应用主题
命令行 jt -t onedork -f fira -fs 13-fs 13 字体
回复原始状态
jt -r# 嵌入视频from IPython.display import VimeoVideoVimeoVideo("63250251",with=600, height=400) File "<ipython-input-21-5e0fd48278da>", line 3 VimeoVideo("63250251",with=600, height=400) ^SyntaxError: invalid syntax# 交互图表import ipywidgetsa=ipywidgets.IntSlider(value=5,min=0, max=10, step=1)aipywidgets.Text()# 嵌入HTML页面from IPython.display import HTMLHTML('<iframe src="https://www.baidu.com" width=800 height=400></iframe>')# 运行外部.py程序# %run xxxx/xxxx.py# Geo-Json安装jupyter lab Python IDE
pip install jupyterlab执行 jupyter lab
杨韬的Python/Jupyter学习笔记
评论关闭